By Jay Landers
Nearly 80 million properties across the contiguous United States have some risk of experiencing a wildfire during the next 30 years. Of these properties, approximately 30 million face at least a moderate risk of sustaining wildfire-related damage during this period. These findings come from a report, released in mid-May, presenting the results of a newly developed model that aims to estimate, for the first time, the current and future wildfire risk for every property in the lower 48 U.S. states.
Development of the wildfire model was led by the First Street Foundation, a nonprofit research and technology group that works to quantify climate-related risks and convey them to the public. The effort builds on the foundation’s release in 2020 of a model that estimates the flood risk for individual properties across the country (see “Foundation Releases Comprehensive US Flood Model, Warns of Greater Risks,” Civil Engineering, September 2020, pages 27-30).
As it did with the results of its flood model, the First Street Foundation is making the findings from its wildfire model freely available to the public. To this end, the foundation maintains the website riskfactor.com, which enables users to look up individual properties and learn their risks related to wildfire and flooding over the next three decades.
A ‘granular understanding’ of risk
The First Street Foundation Wildfire Model is the “only nationwide, probabilistic, climate adjusted, peer reviewed, property specific wildfire risk model for properties in the contiguous United States,” according to a May 16 news release from the foundation. Findings from the model were detailed in a report from the foundation titled The 5th National Risk Assessment: Fueling the Flames.
First Street’s Wildfire Model “computes estimates of the 30-year, climate-adjusted aggregate wildfire hazard for the contiguous United States at the 30 meter horizontal resolution,” according to the report. “The development of such a model is based on the unique risk each individual property faces and should help to provide homeowners with home mitigation solutions.”
“Our hyperlocal resolution allows for an extremely granular understanding of wildfire risk, empowering citizens, government, and industry to take steps to mitigate wildfire risk,” says Matthew Eby, the founder and executive director of the First Street Foundation. “Enhanced understanding of the specific nature and location and severity of wildfire risk enables everyone to make more informed decisions,” he says.
Accounting for climate change
To model fire behavior, the Wildfire Model incorporates data regarding fuels, wildfire weather, and ignition. The model was used to simulate a wide range of wildfire and weather conditions for 2022 and 2052, accounting for future climate change.
“We ‘climate adjust’ our data by simulating future forest conditions and weather conditions driven by the Intergovernmental Panel on Climate Change's Representative Concentration Pathways,” Eby says, referring to the varying greenhouse gas concentrations used by the IPCC for climate modeling.
“To generate useful statistics of fire conditions for our fire models, we use a 10-year time series of (the National Oceanic and Atmospheric Administration’s) historical weather data to resolve the full range of fire weather conditions for the current climate,” Eby says. “For future fire weather conditions, we create a 10-year simulation of weather for the forecasted 2052 environment. This allows our wildfire simulations in 2022 and 2052 to be informed by the full range of possible wildfire conditions.”
Calculating overall risk
In a novel move, the team developing the First Street model reclassified homes and other buildings from a “nonburnable” fuel type to a “burnable” fuel type. This approach results in the most accurate portrayal of wildfire and its interaction with structures, Eby says.
“To understand how wildfire spreads from forests or other wildlands into the built environment, it is critical to ensure that all potential fuel sources that sit outside the wildland-urban interface are understood as potential fuel sources that can carry wildfire spread,” Eby says. “Our model is the first model to treat homes outside of the (wildland-urban interface) as ‘burnable’ fuels. This allows us to simulate the real impacts of wildfire spread as the flames and embers move from the (wildland-urban interface) to the urban environment.”
Working with the global built environment consulting firm Arup, First Street also included in the model property-specific data to better reflect the vulnerability of individual properties to wildfire.
“Arup utilized the characteristics of the property, including the type of roof and siding material, to determine the likelihood that the building would ignite in various wildfire scenarios and the resulting consequences in terms of financial losses and downtime,” says Ibbi Almufti, S.E., P.E., P.Eng., Arup’s Americas West risk and resilience leader. “When paired with First Street Foundation’s wildfire hazard model, which indicates the likelihood and corresponding intensity of wildfires at the property, the overall risk can be calculated,” Almufti says.
Other entities contributing to the development of the Wildfire Model included the Spatial Informatics Group, the fire protection engineering firm Reax Engineering, Eagle Rock Analytics, and the U.S. Geological Survey.
Regional differences
Of the 79.8 million U.S. properties at risk of wildfire, 49.4 million are categorized as having a “minor risk,” meaning that they have less than 1% risk of being in a wildfire during the next 30 years or are at risk from embers only, according to the report. Meanwhile, 20.2 million properties are deemed to have a “moderate risk,” which the report defines as a 1- 6% risk of wildfire over 30 years.
Six million properties are said to face “major risk,” which the report defines as a 6-14% risk over the next three decades. Another 2.7 million properties, or 1.9% of all properties, are deemed to have “severe risk,” which equates to a 14-26% risk over 30 years. Finally, 1.5 million properties, or 1.1% of all properties, are said to be at “extreme risk,” or risk greater than 26% over 30 years.
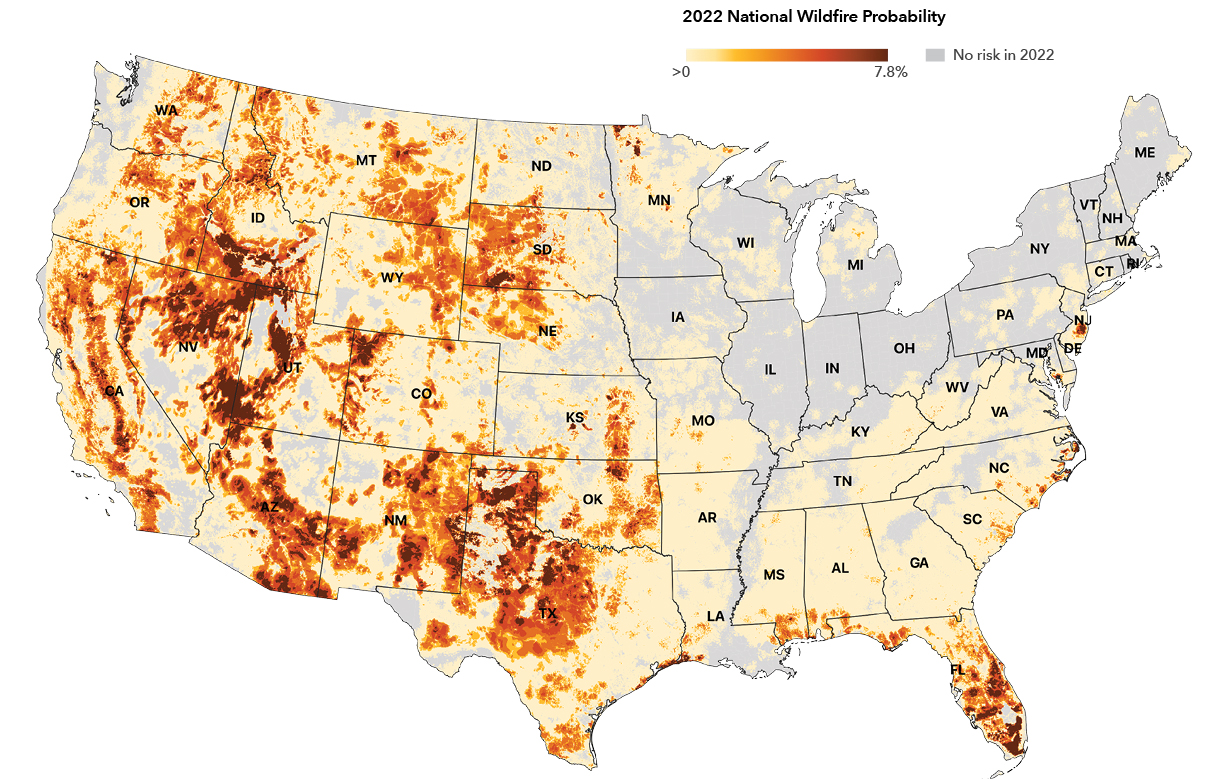
As might be expected, the Northeast and Midwest regions of the country were found to have the fewest properties at risk of wildfire, with 6.4 million and 10.4 million, respectively. The vast majority of them were considered at minor or moderate risk. Although the South was found to have the most properties at risk, at 43 million, roughly 90% were said to face minor or moderate risk. Meanwhile, in the more arid but less populated West, 19.9 million properties are considered at-risk, nearly 30% of which are considered to have major, severe, or extreme risk.
Among the individual states, California has the highest number of properties projected to be at risk, at 4.65 million, followed by Texas (4.56 million), Florida (3.93 million), Arizona (1.89 million), and Oklahoma (1.14 million). The report includes overviews of the 39 states having properties with at least a 0.2% annual burn probability.
The large numbers of at-risk properties in the southeastern United States was something of a surprise, Eby says. “At the outset of our study, most of the researchers on our team hadn't expected to find so much wildfire risk in the Southeast,” he says. “Florida, for example, is understood to face substantial and worsening flood risks from heavy rains, storm surge, and sea level rise, but we were surprised at the scale of wildfire risk in the state and how much it was growing over time due to a changing climate. This was true through many parts of the Southeast and East Coast generally.”