By Jay Landers
When Hurricane Florence struck North Carolina in September 2018, the storm lingered over the state for four days, killing more than 30 people and leaving devastation in its wake.
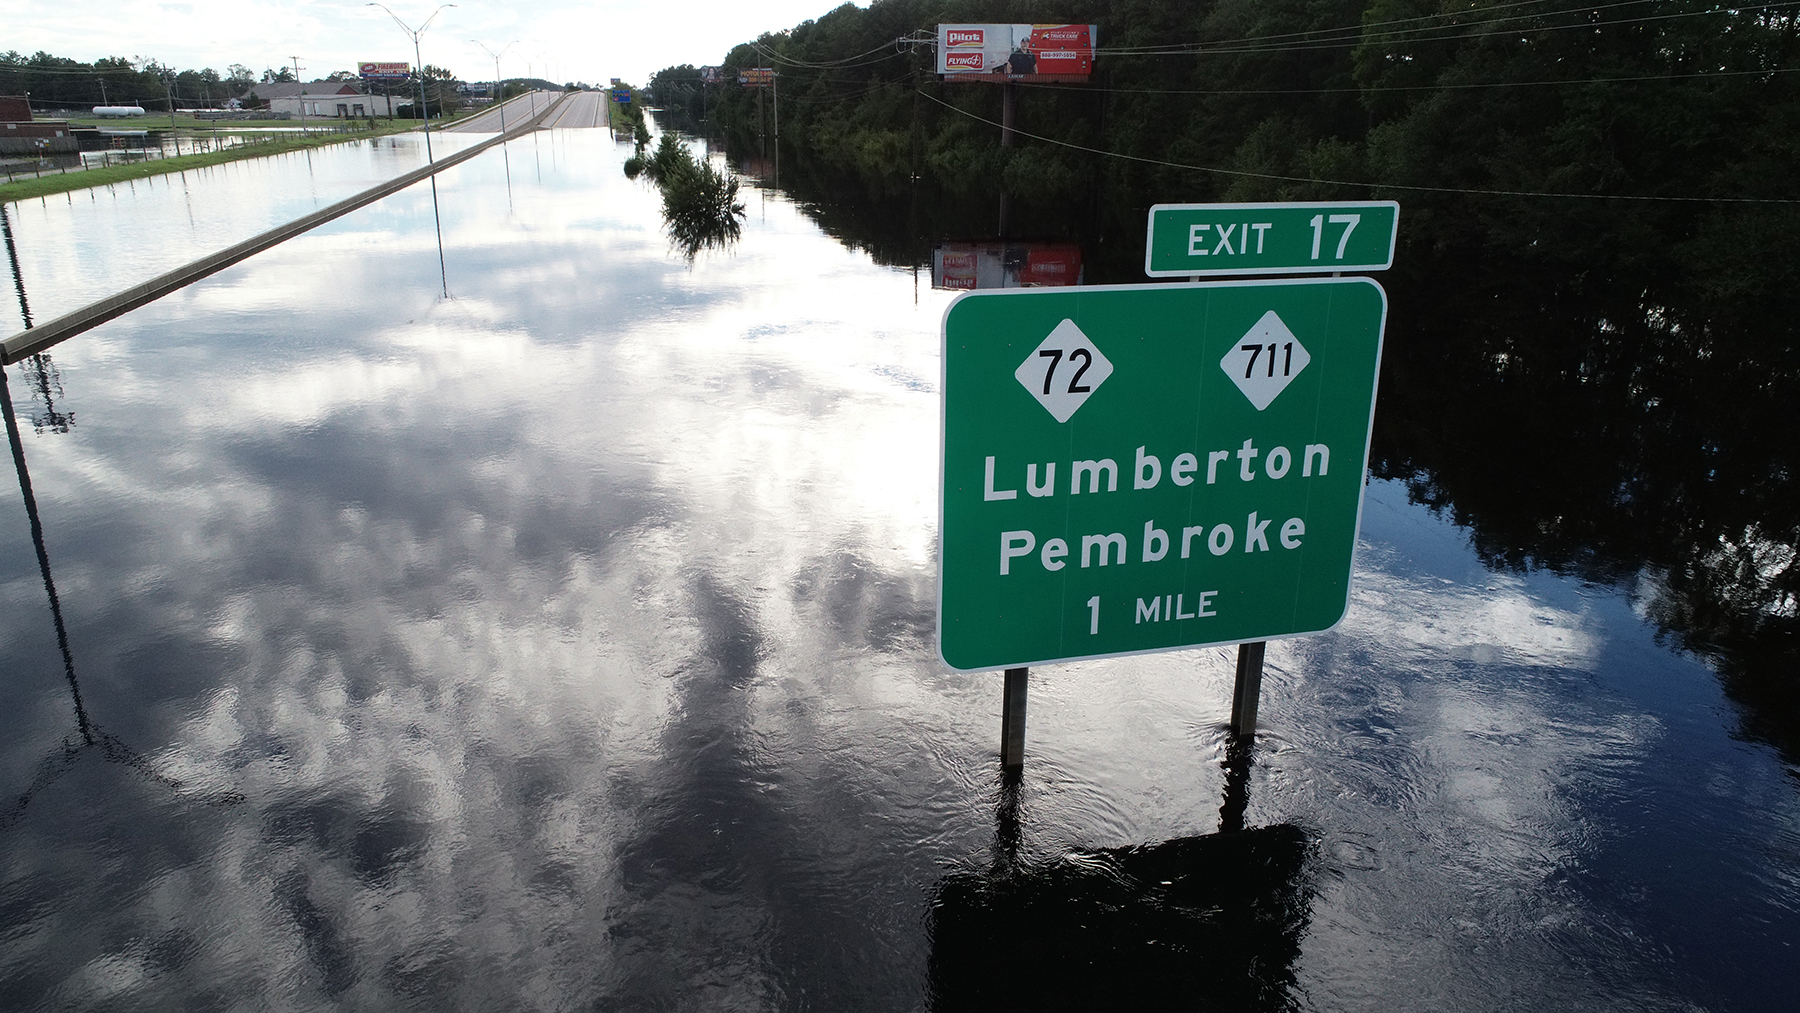
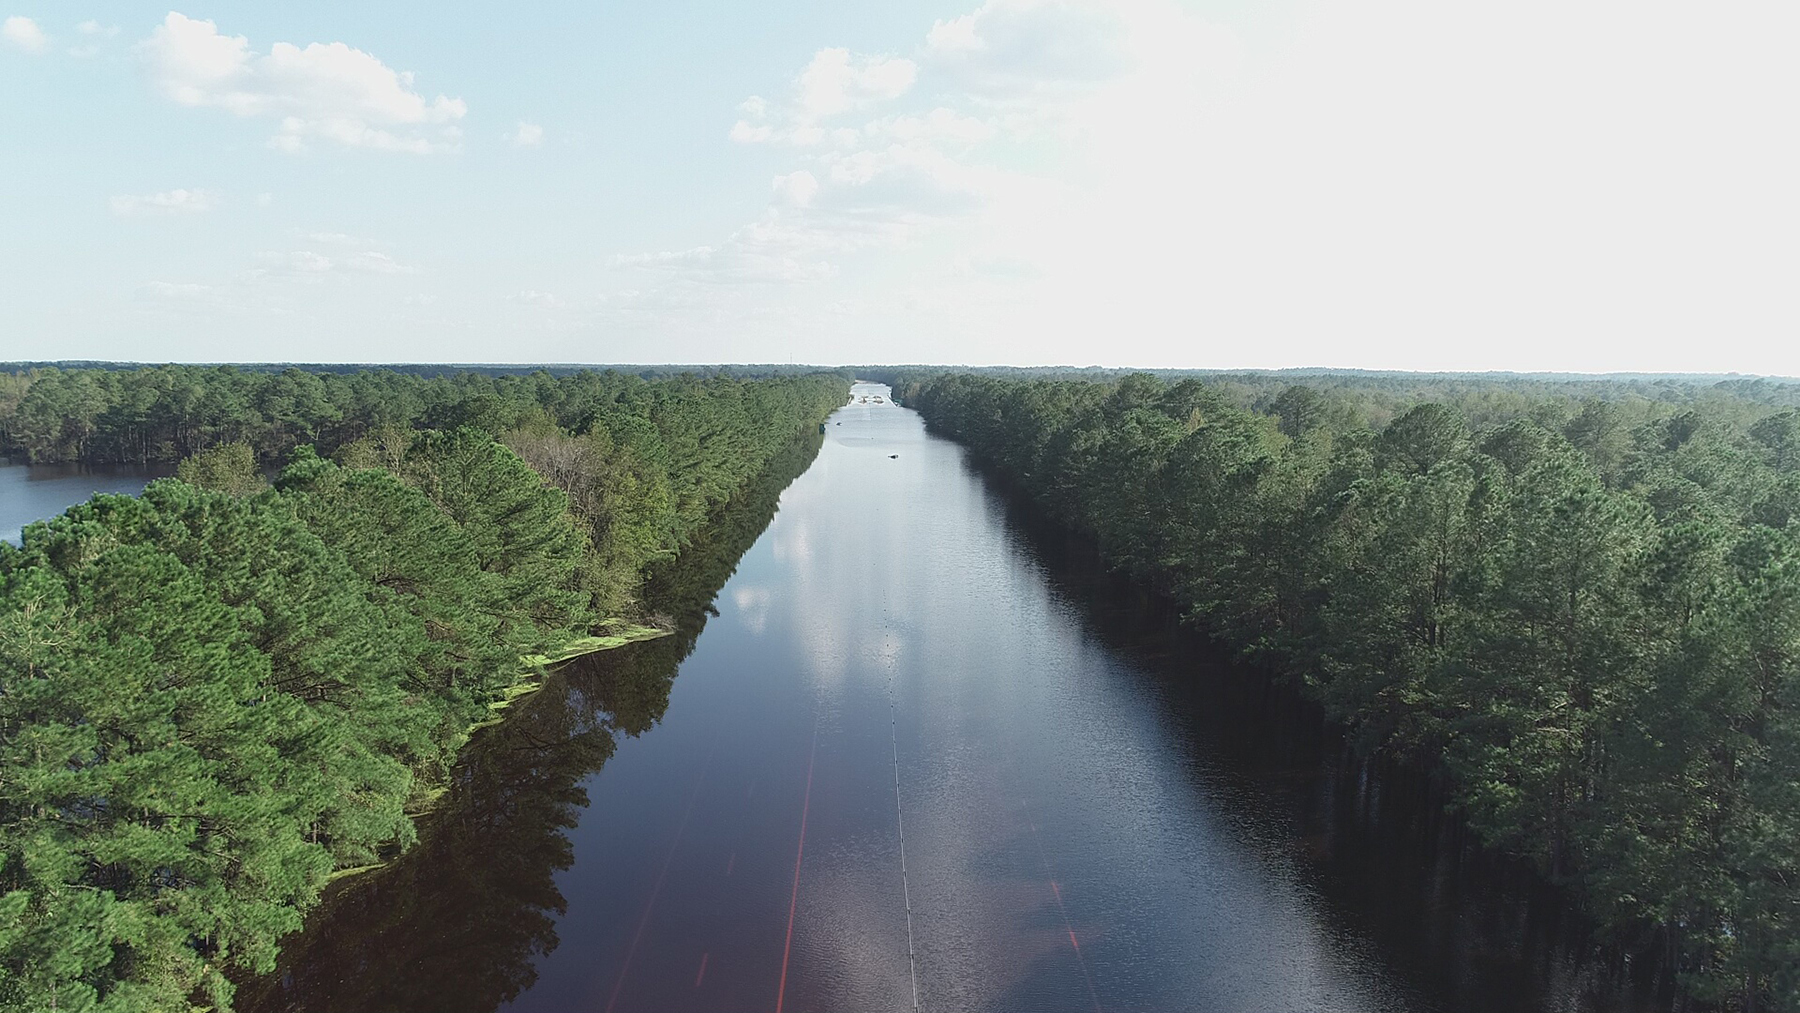
The southeastern portion of the state was especially hard hit by flooding, effectively shutting down surface transportation in the region, says Matthew Lauffer, P.E., the state hydraulics design engineer within the Hydraulics Unit of the North Carolina Department of Transportation. “Basically, all of southeastern North Carolina was closed,” Lauffer says.
Because of the flooding, the city of Wilmington was inaccessible by roadway for more than a day. “You had to take a boat,” Lauffer says. Meanwhile, sections of two of the state’s most critical highways, Interstates 40 and 95, remained underwater for more than a week. “It was chaos,” he notes.
Because of the magnitude of the flooding event, NCDOT staff were unable to access the flooded areas. As a result, the NCDOT lacked a clear, immediate picture of the full extent of the flooding along its roadway network. Following this devastating event, the NCDOT set out to develop a system for monitoring the flood conditions of its infrastructure assets, which include approximately 80,000 mi of highway and more than 15,000 major waterway structures. With the 2022 hurricane season having recently begun, the NCDOT is piloting three different, but complementary, systems for monitoring flood conditions on its roadways: a web-based flood monitoring system, a storm surge prediction tool, and a dedicated bridge monitoring system.
Improved resilience
With the monitoring systems in place, the NCDOT aims to achieve several goals. The “primary reason” for monitoring flood conditions along its roadway network is “to save lives,” Lauffer says. In addition, the monitoring will enable the NCDOT to “give our decision-makers better information faster and help the department prepare for, respond to, and recover more quickly from these extreme events,” he says. As a result, the monitoring “will ultimately help us operate the transportation network more efficiently, making it more resilient as we go forward.”
Increased resilience will be necessary if the NCDOT is to cope with changing environmental conditions, including the likelihood of increased rainfall, more frequent and intense hurricanes, and sea level rise. “We expect to have more impacts to our system as we go forward,” Lauffer says. “These (monitoring) systems should help us better respond to and recover from them when they do occur.”
Mapping roadway inundation
In 2020, the NCDOT began the process of adapting for its purposes a web-based flood monitoring system developed by North Carolina Emergency Management, a division of the North Carolina Department of Public Safety. Known as the Flood Inundation Mapping Alert Network, or FIMAN, the monitoring system incorporates data from a network of more than 400 flood gauges.
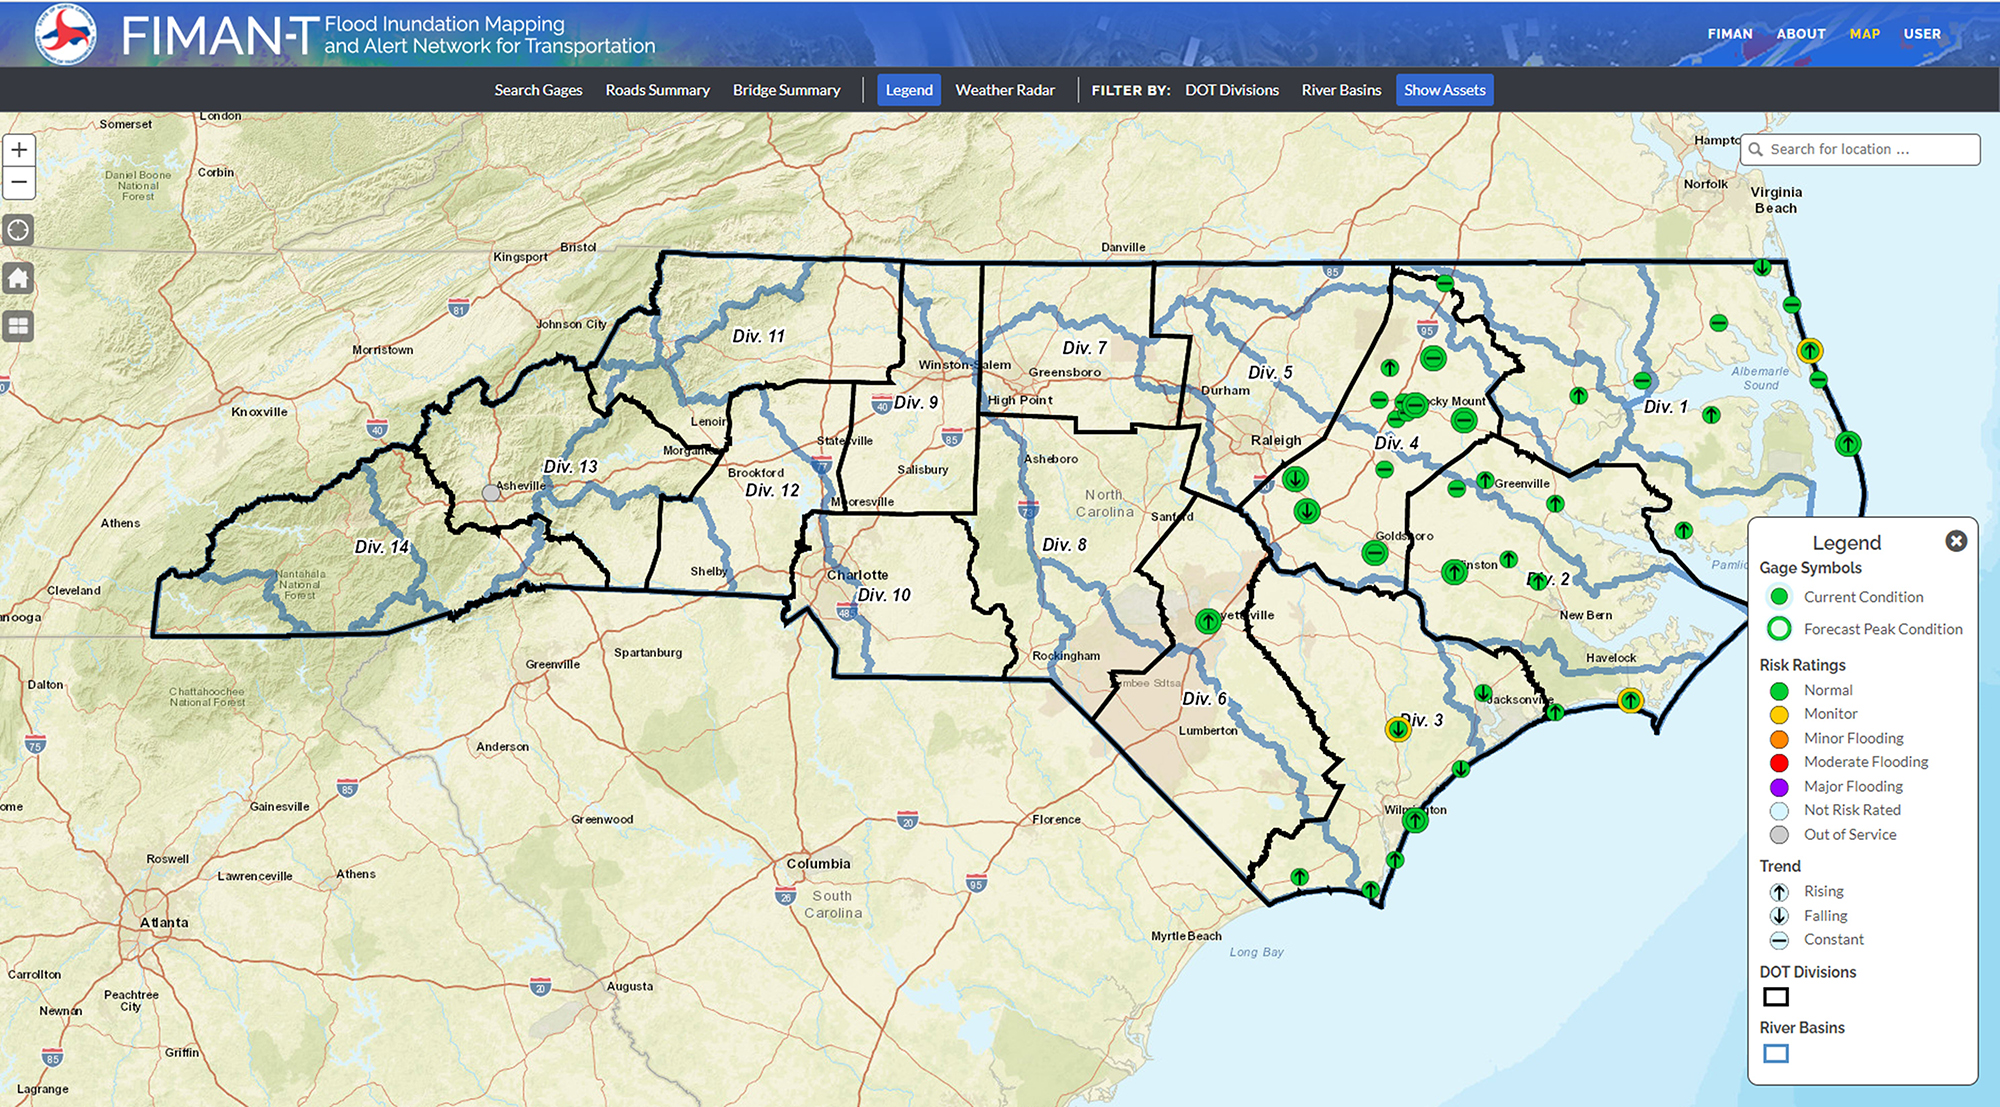
Flood inundation data from this network is overlaid on existing building information to identify the number and locations of flooded structures during a flood event. Updated every 15 minutes, FIMAN provides a real-time source of flooding information as well as flood forecasts for the state’s emergency personnel and the public.
Instead of tracking flooded structures, the NCDOT wanted to use FIMAN to monitor flood conditions along roadways, bridges, and culverts. To this end, existing lidar data depicting the elevations of the state’s roadway network was added to the monitoring system as part of efforts to create a new version known as FIMAN for Transportation, or FIMAN-T.
“We could now map roadway inundation and report out on the metrics, the depth of inundation, on that roadway network,” Lauffer says. Like its predecessor, FIMAN-T can indicate current and forecasted flood depths, but for roadways rather than buildings. Because it incorporates the state’s bridge database, the monitoring system can provide real-time information regarding such critical details as bridge overtopping.
Predicting storm surges
The NCDOT also has developed a subset of FIMAN-T, one that focuses on the effects to the state’s coastal roadways from storm surges associated with the landfall of hurricanes. “Hurricanes bring in immense rainfall and immense flooding,” Lauffer says. “That’s when people get trapped and they can drown. That’s where the majority of the deaths (from flooding) occur.”
Developed by the NCDOT in partnership with the U.S. Department of Homeland Security’s Coastal Resilience Center of Excellence at the University of North Carolina at Chapel Hill, FIMAN-T Surge is intended to predict the locations and extent of storm surges approximately 48 hours before a hurricane makes landfall on the state’s coast. The FIMAN-T Surge system relies in part on the results of a hydrodynamic model, known as ADCIRC, that is operated by researchers at UNC at Chapel Hill.
“We can use (results from FIMAN-T Surge) to look at our road impacts and basically position resources, or we can look at which bridges might be vulnerable due to that surge and wave height and then take appropriate action at that time,” Lauffer says.
Broader bridge coverage
As useful as FIMAN-T may be, the monitoring system is unable to provide statewide coverage of flood conditions on roadways, because it is limited to the areas served by the flood gauges on which it relies.
To ensure broader coverage of its roadway network, the NCDOT has partnered with U.S. Engineering Solutions Corp., a maker of software solutions used to monitor in real time such infrastructure as bridges, dams, and levees. In particular, the department has begun pilot-testing the company’s BridgeWatch software as a means of monitoring the flood conditions of approximately 3,000 of the 15,500 priority bridges and culverts across North Carolina. Eventually, the NCDOT intends to monitor all 15,500 of the facilities.
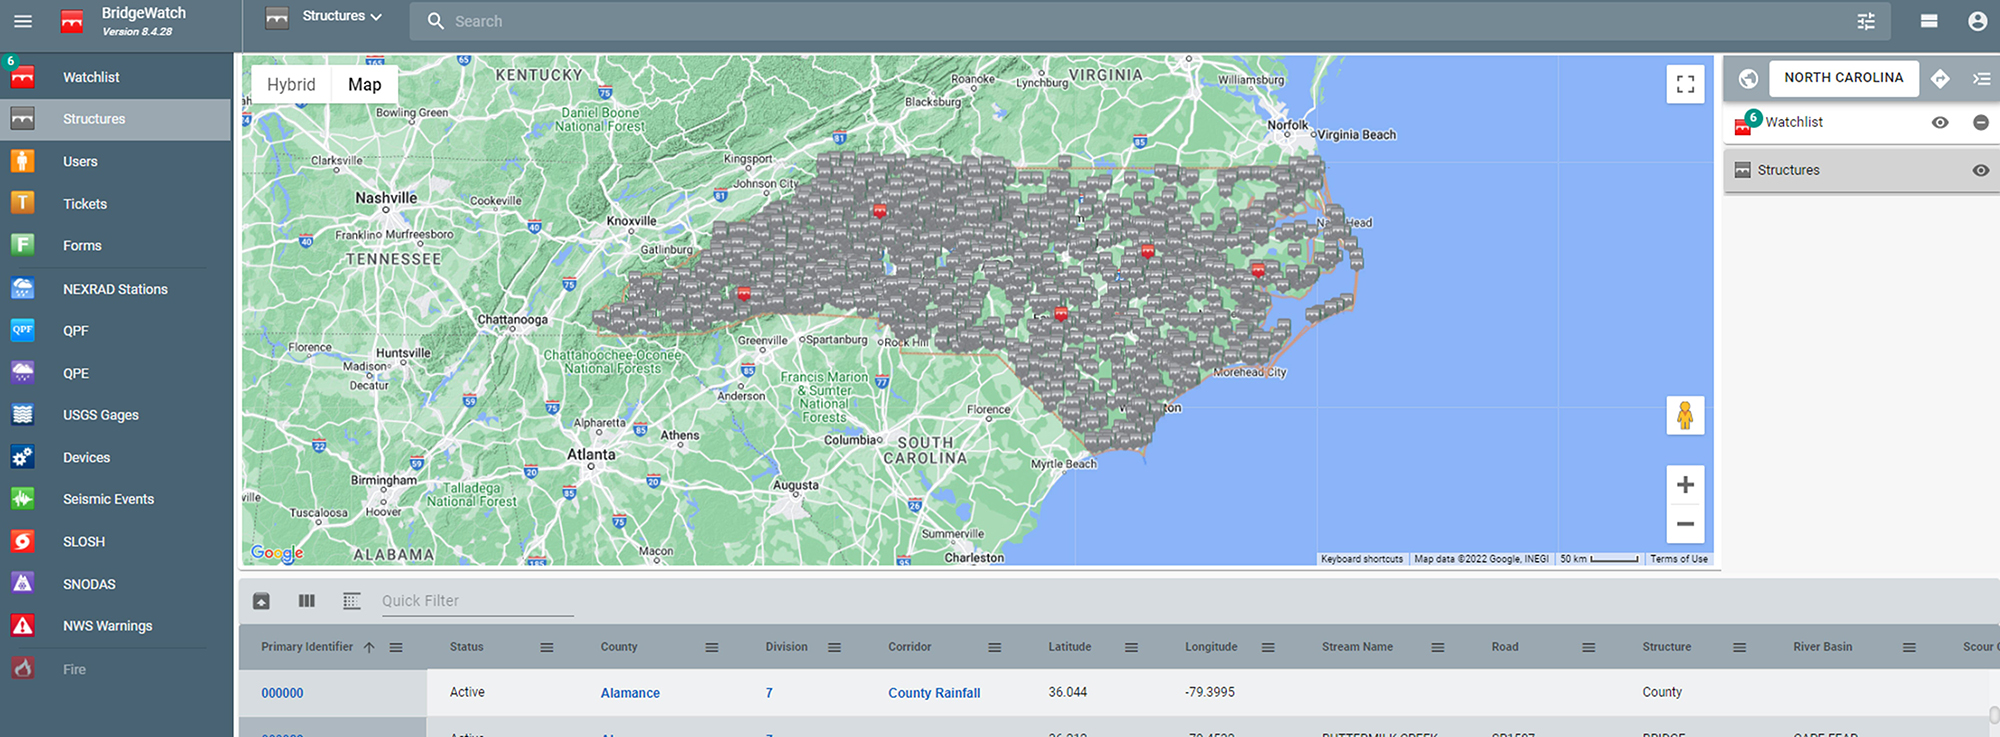
By collecting and processing real-time data from flood gauges as well as other sources that provide weather, hydrologic, oceanographic, and similar data, BridgeWatch is able to compare the results against the NCDOT’s own data to determine if a bridge or roadway is likely to be affected or has been affected by flood conditions. Alerts then can be sent to the appropriate representatives at the department. For example, the system may be configured to notify officials if rainfall totals, either actual or forecasted, for a given drainage area exceed predetermined thresholds. Similarly, alerts may indicate if stream levels are nearing the lowest structure member of a bridge, are touching the member, or have overtopped the bridge or its approaches.
Depending on the nature of an alert, the NCDOT may respond in different ways, Lauffer says. Road closures can be implemented faster, improving public safety. Following an event, the department may dispatch investigators to inspect a bridge “to make sure that it’s safe for the motoring public,” he says. Maintenance staff also receive alerts, giving them “awareness of where the vulnerabilities are in the system.”
Finally, BridgeWatch also is expected to help the NCDOT better track the condition of its infrastructure assets over time. “This tool can also help us with asset management, because it maintains (flooding) information in the database,” Lauffer says. “We can go back over the course of how long we’ve been monitoring and then figure out how many big events a location has had.”
Communicating results
Real-time data from FIMAN-T, FIMAN-T Surge, and BridgeWatch will be made available to the NCDOT team that manages DriveNC.gov, the state’s interactive online system used to notify the traveling public of traffic incidents on roadways throughout North Carolina. The team then has the option to include this data as part of what is publicly available on the website.
Part of the ongoing pilot-test of the flood monitoring systems will involve confirming data in the field to ensure that information made publicly available is as accurate as possible. “It’s important to note there are limitations on this data,” Lauffer says. “There needs to be understanding of the data and how we process it until we get more comprehensive coverage in the system. We want to make sure there’s one consistent information source for the motoring public.”