
By Douglas D. Gransberg, Ph.D., P.E., F.ASCE, H. David Jeong, Ph.D., M.ASCE, and Nils J. Gransberg, Ph.D., A.M.ASCE
Construction project owners expect the civil engineers who design their projects to produce sets of biddable construction documents that will ultimately lead to construction contract awards within budget parameters established when the designer is initially retained. In fact, for federal government projects, the Federal Acquisition Regulation 52.236-22: Design Within Funding Limitations requires that when a project’s bids exceed the stipulated budget, the project must be redesigned at the designer’s expense. This creates a difficult conundrum for the designer.
On the one hand, the project’s functional scope is contractually fixed. On the other hand, the costs of material, labor, and equipment will vary with the marketplace, changing throughout the period it takes to complete the design, advertise, and award the construction contract. The issue is further exacerbated when the owner’s budget is established before the details of the design are known. Owners and designers are forced to establish contingencies and engineering economics to estimate the future impact of market fluctuations. Conversely, the contractor’s bid is based on real-time market pricing on bid day. This includes the ability to obtain hard quotes for materials and subcontractors for delivery and installation in the future.
This is not an article about the economics of construction contracting but rather one that presents a few tools to make cost-conscious design decisions by exploiting available cost data. It will demonstrate how investing in data-driven decision-making tools can inform the process. It is especially valuable for features of work for which alternative technologies are available to satisfy the functional engineering requirements. Typical examples are pavement selection; steel, precast, or cast-in-place structural members; and metal, concrete, and polyethylene culvert types. Since project location is generally the primary factor that drives construction costs, the tools in this article are all based on a geospatial platform. This platform allows the designer to visualize the cost of alternative design solutions for the project’s location.
Cost-driven design decisions
For the designer, the scope of work is fixed by the technical and functional requirements of the project, and the schedule is fixed by the owner’s need for the completed project. Thus, the cost is the variable that must change to accommodate the scope and schedule, and its value will not be known until the design is complete and the bids are opened. If all the bids are higher than the project’s budget, then the construction contract cannot be awarded, and the owner is deprived of the benefit of the project, making the design fee a sunk cost.
To avoid losing the value of the design effort, the owner must either obtain additional funding or reduce the project’s scope to meet the available funding. This is often improperly termed “value engineering,” but in actuality it is merely looking for ways to make the project cheaper by cutting features of work. The design effort required to develop the eliminated features of work is lost, and often additional design effort is required to prepare the down-scoped project for rebidding. The schedule cannot be met, and until the revised construction documents can be rebid, the costs of construction are once again exposed to changes in market conditions.
Often design solutions are selected based on longstanding assumptions regarding the final technical details of the project. For example, a structural engineer might enter into the design process with the idea that precast-concrete structural members are called for based on existing bridges built by this particular owner. Hence, the designer dismisses other alternative structural systems.
Additionally, since the development and analysis of technical alternatives add to the cost of the final design, the designer feels justified in making a key design decision based on past experience. The issue then becomes whether the specified material is available within the budget and required schedule.
In the post-COVID construction market, supply chain constraints and increased demand for materials have made it difficult to obtain the necessary materials and labor. The solution is to challenge the traditional assumptions related to fundamental design decisions and conduct market research to validate that the assumptions are still viable before investing the design effort to produce construction documents based on those assumptions.
Exploiting available cost data
A good case in point is choosing between asphalt and concrete pavement. Without getting into the life cycle cost controversy, conventional wisdom would dictate that asphalt would always be the lower first-cost option. Generating alternatives using concrete would be a waste of resources on a project in which budget considerations are overriding. For example, the Montana Department of Transportation is tasked with providing reliable transportation for the nation’s fourth-largest state in land area with less than 1 million taxpaying travelers. MDT must stretch every available dollar to gain maximum value.
Hence, one will find that in Montana, concrete pavements are rare. Montana is also blessed with a highly varied terrain from the Rocky Mountains in the west to the Great Plains in the east. This makes a pavement project’s cost highly dependent on its location; therefore, a geospatial understanding of how construction costs vary across the state is a valuable decision-making tool. Figure 1 is the output from displaying MDT bid tabulation results for hot mix asphalt as a heat map on a geographic information system platform.
Figure 1 shows that asphalt pavement is much more expensive in the northwest corner of the state than in other areas. This region includes Glacier National Park, which is in the Rockies. Not only does the remoteness of the area impact construction costs but also the hot mix paving season is much shorter than at lower elevations. This time constraint requires the contractor to work longer shifts and pay overtime to complete paving before temperatures dip below specified minimums.
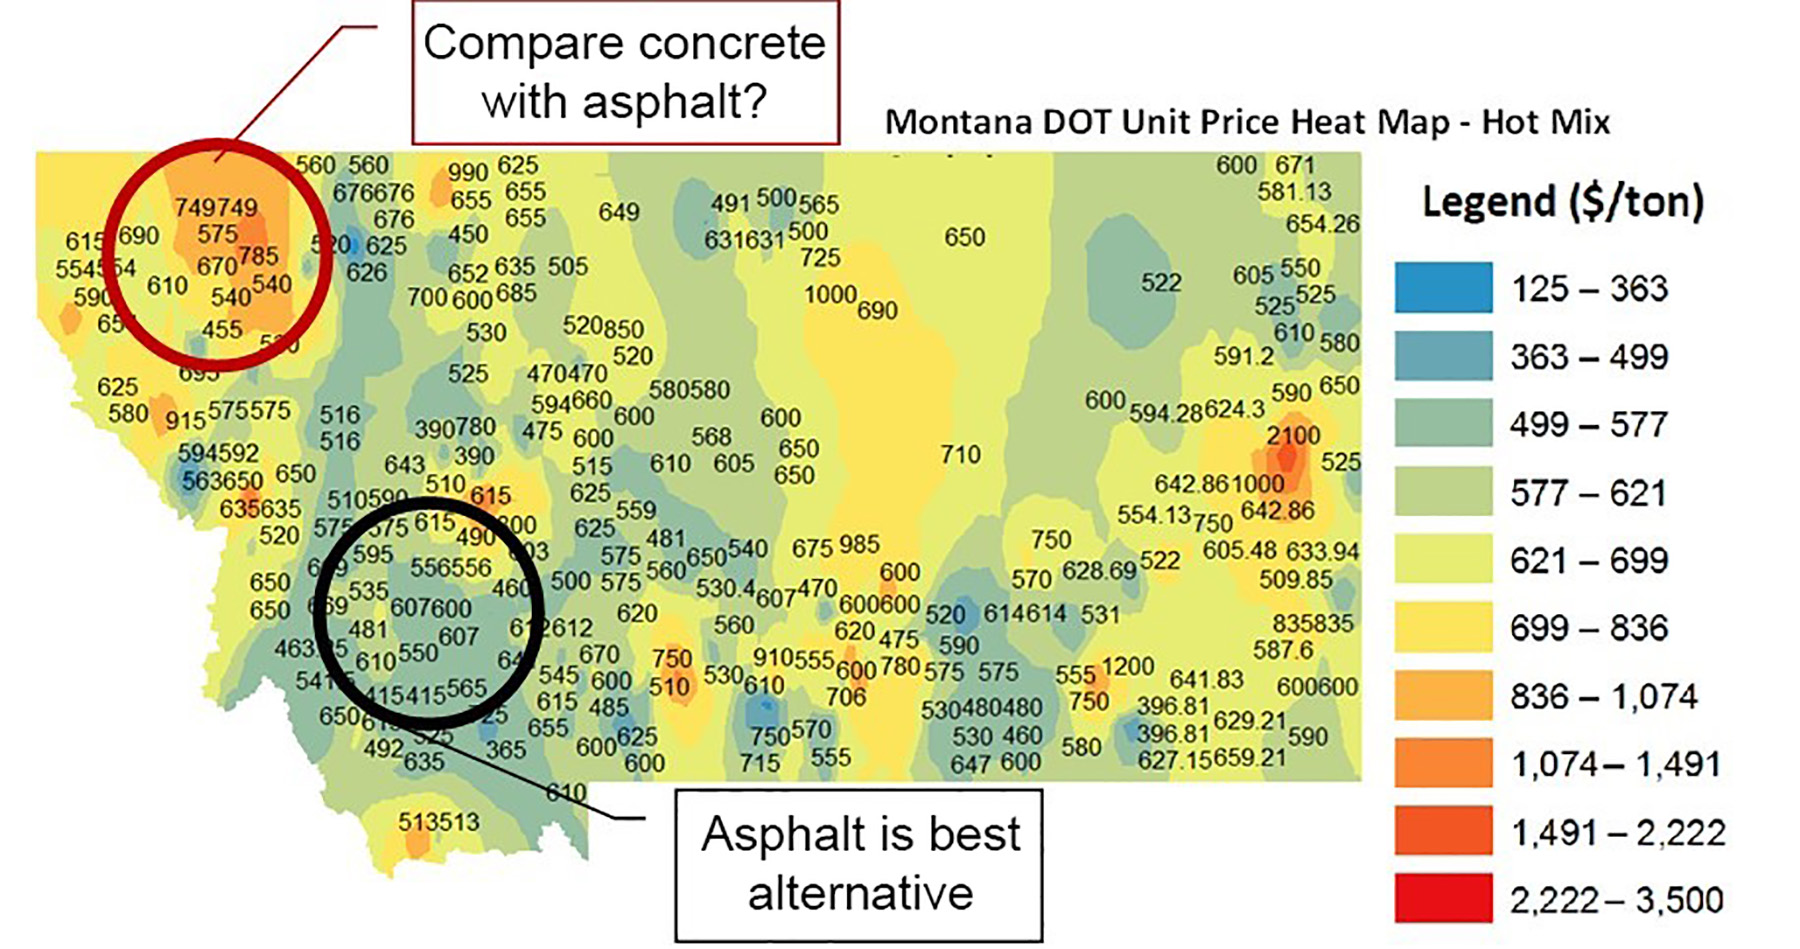
Seeing that asphalt pavement is nearly double the average cost statewide provides justification to invest the additional cost to generate a concrete pavement alternative and compare it to asphalt pavement. When other factors such as the increased service life, resistance to snowplowing, and reduced maintenance are added into the pavement type design decision, the use of concrete may indeed be well justified.
The flaw of averages
State DOTs have a constant supply of bid tabulation data that is refreshed at every letting. Most DOTs collect the average low-bid unit prices for use in estimating. The problem with using statewide average unit prices is that the mean value is influenced by outliers, and prices are not correlated to project location. As seen in the MDT example, variation by location can be significant, and being able to do cost analyses based on geospatial variation can inform design decisions in a manner that encourages keeping the cost within the project’s budget. The available bid tabulation data can be leveraged in the same manner as for every bid item in the state’s specification book.
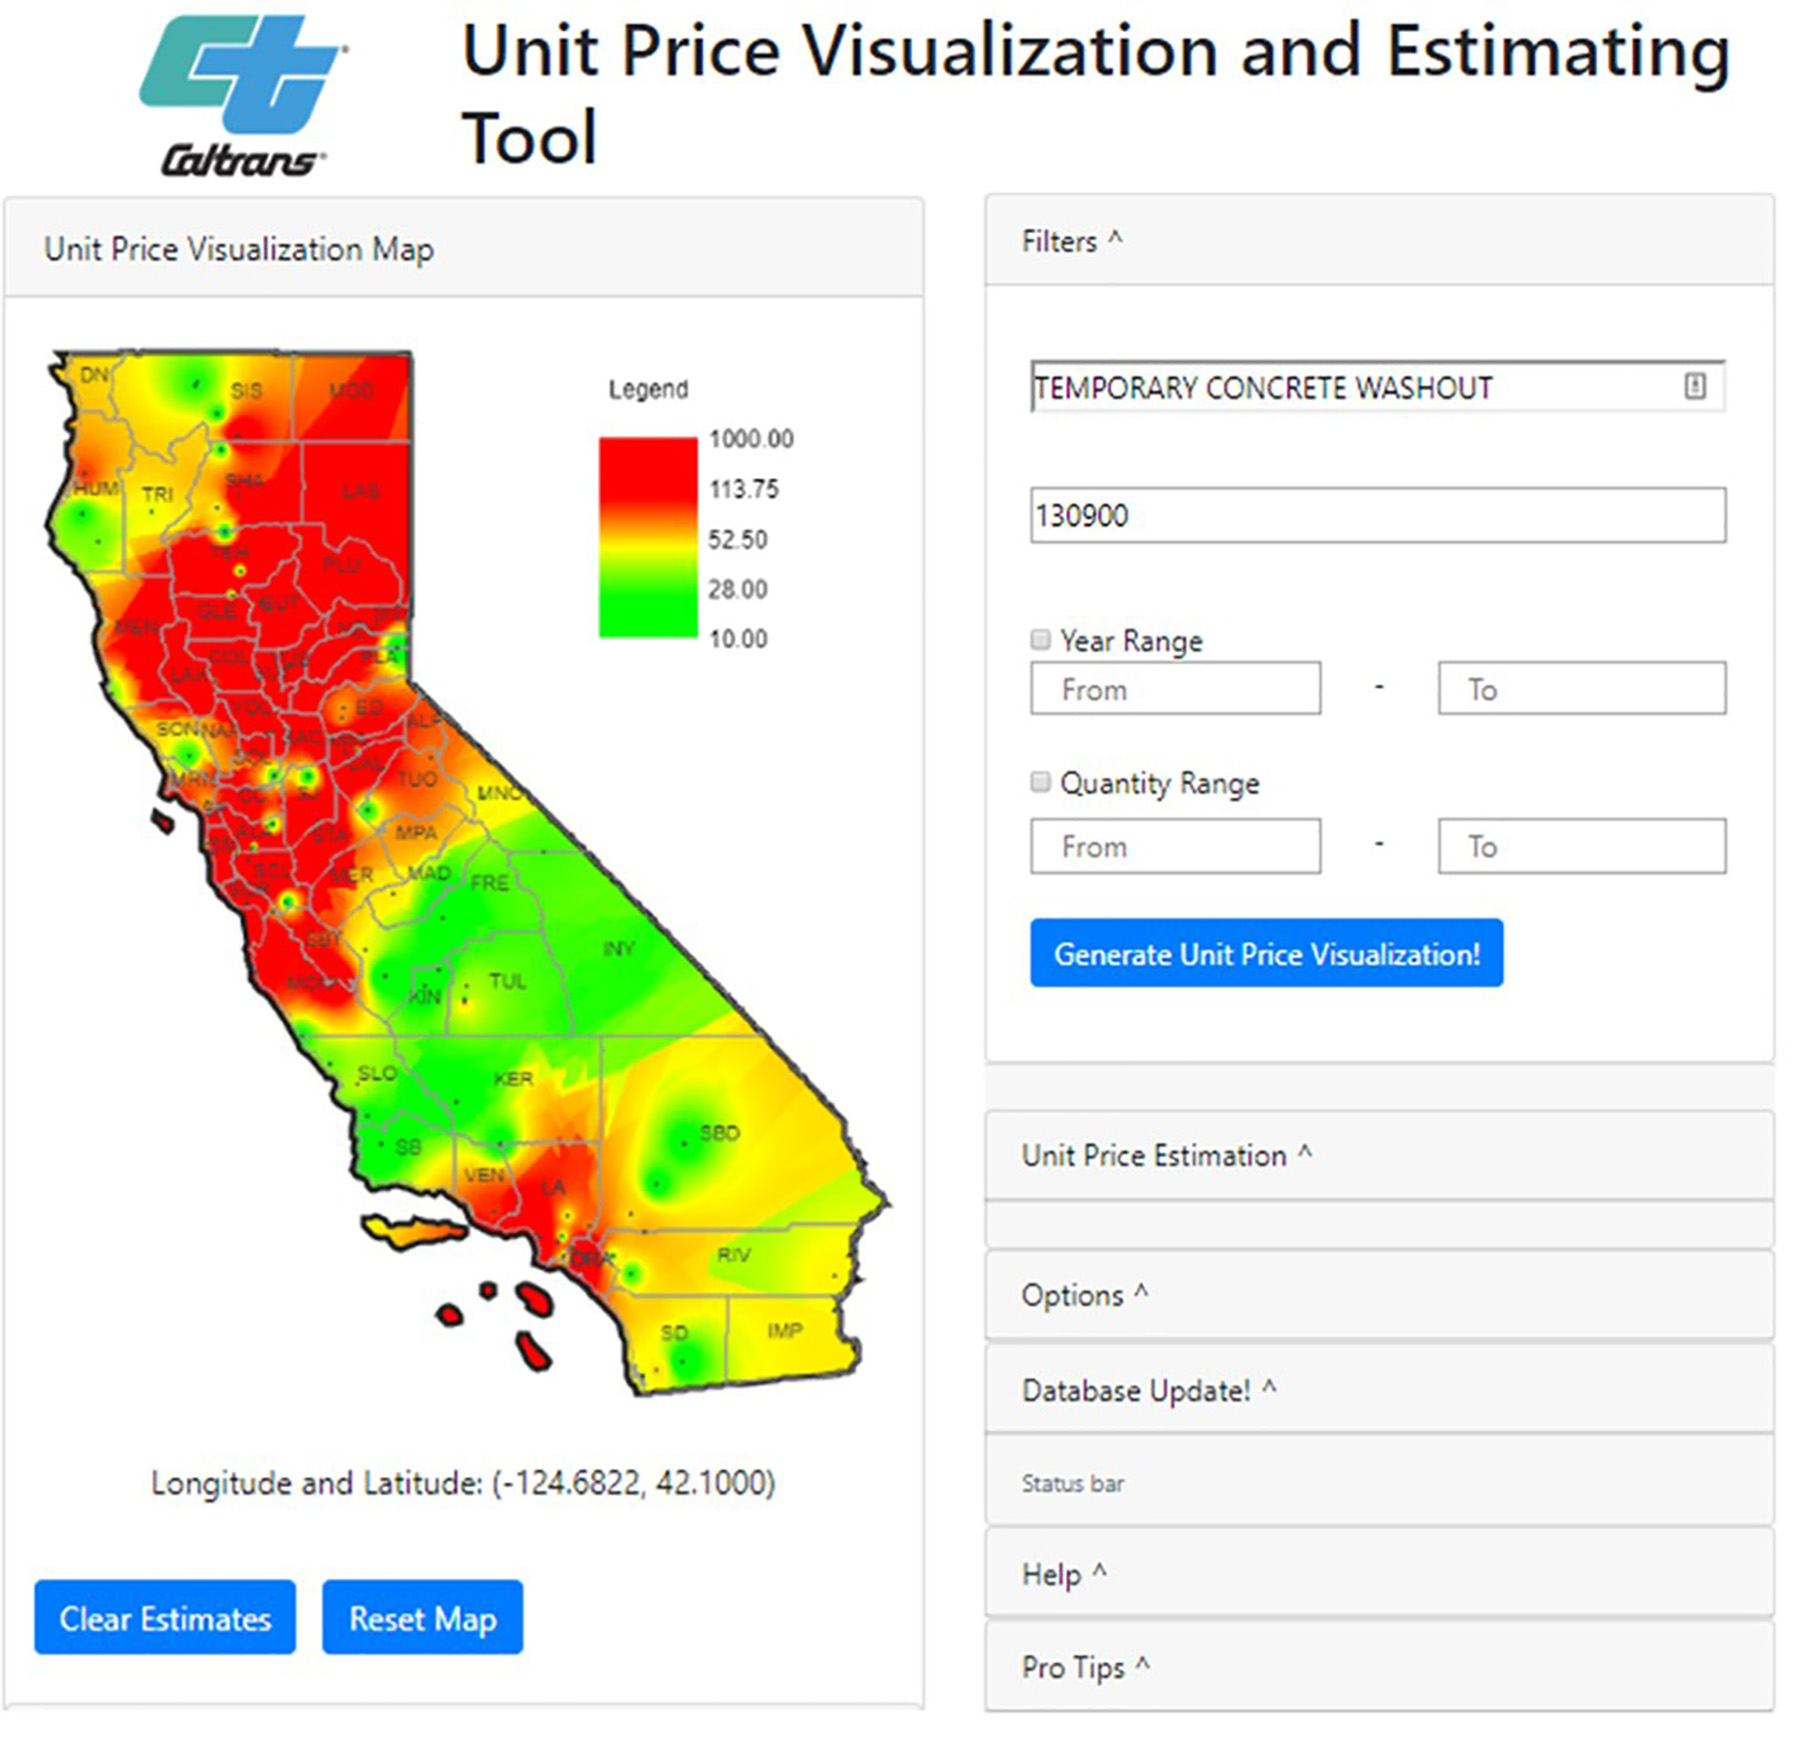
The California DOT (Caltrans) invested in a GIS unit price platform that allows its designers to make the comparison of alternatives in real time using the latest bid results. Figure 2 shows the impact of location in California for one bid item. Projects in Northern California can be expected to cost significantly more than projects in the central part of the state. Thus, for projects in the red zone, designers should evaluate alternative solutions before making decisions.
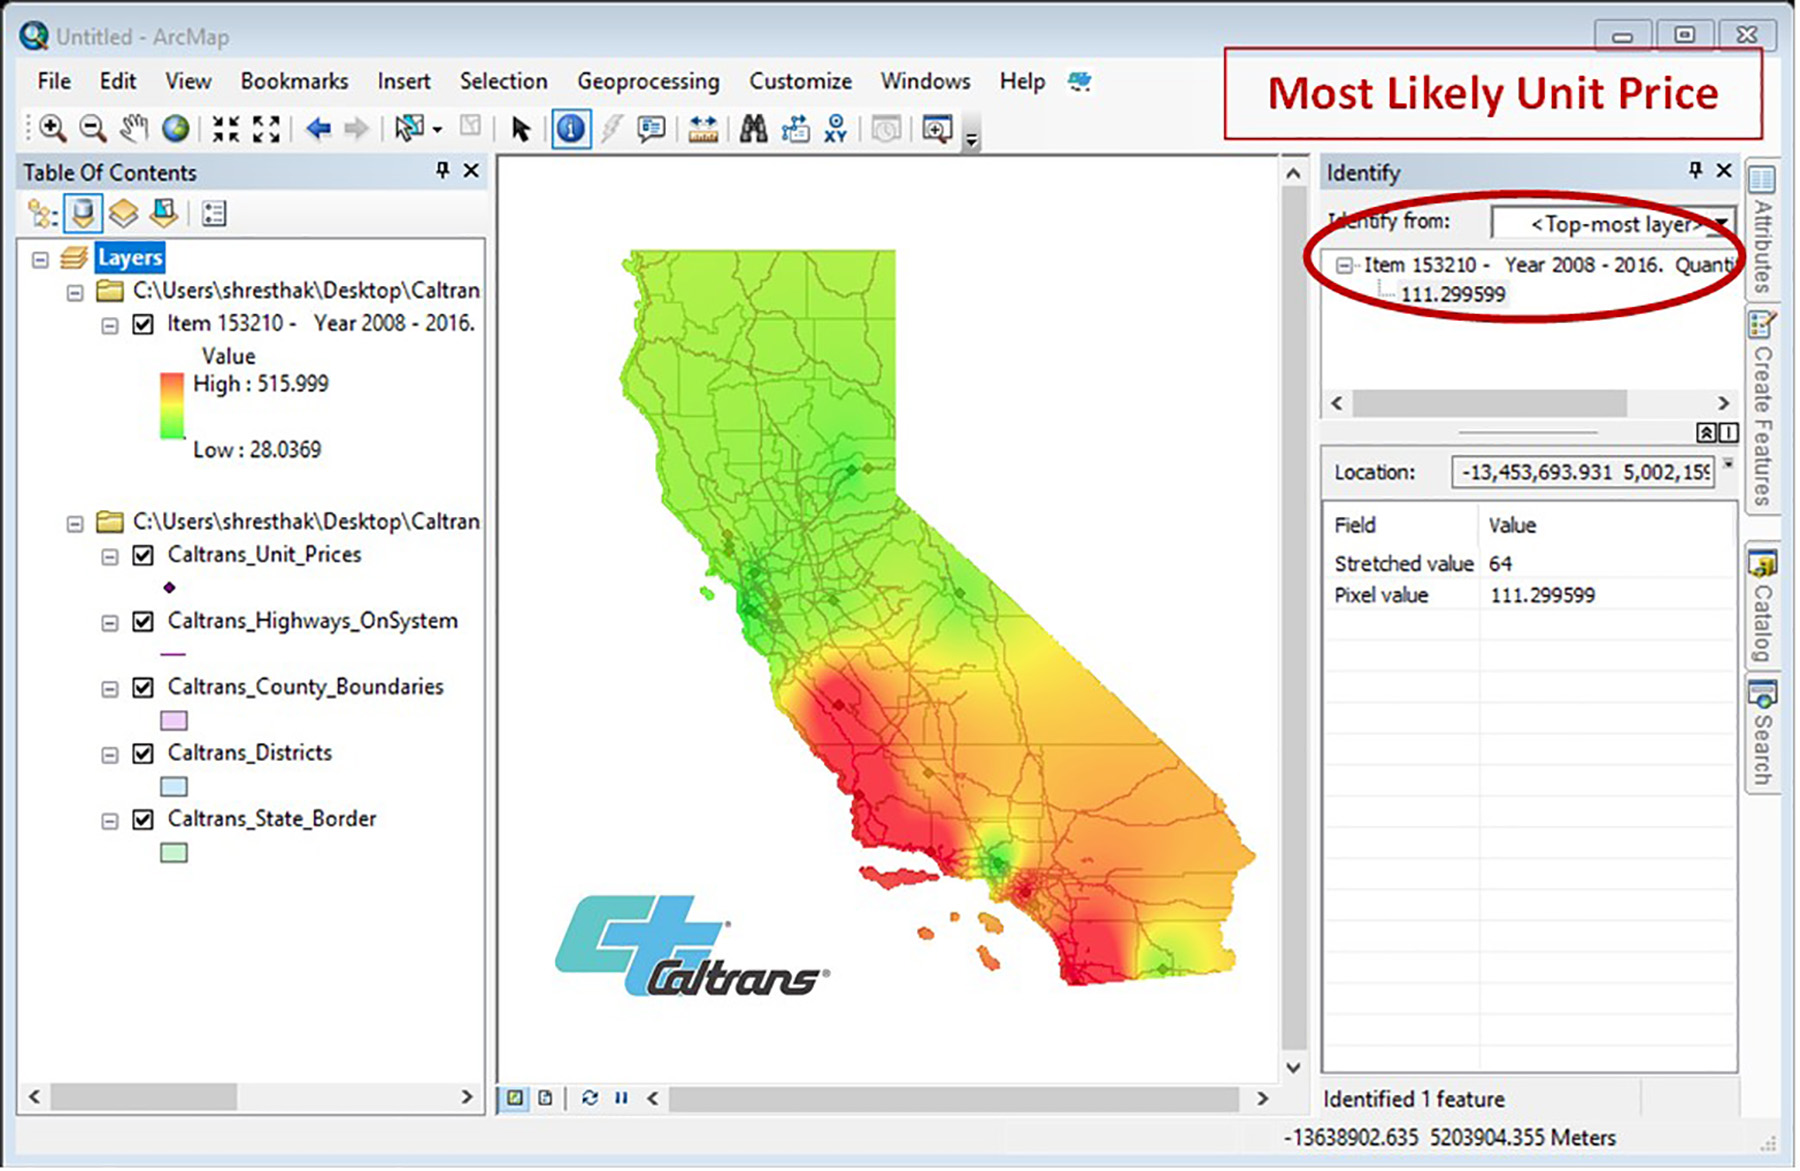
As shown in Figure 3, the Caltrans system also calculates the most likely unit price when given the longitude and latitude of the project. The system can also be refreshed periodically if desired. Since the current unit price for all pay items is available, multiple alternatives can be evaluated visually before the designer settles on the one that will be found in the final construction documents.
Visualizing the technical aspects
Technical specifications are generally considered inviolable, and designers rarely question whether they can be adjusted to reduce the overall cost of a project. A typical example is specifications for aggregate that is incorporated into pavements. A major portion of the construction cost for aggregate is the cost to transport it from the quarry to the project site or batch plant.
Unfortunately, the geology of a given area is fixed, and hence, some projects will be in areas where suitable aggregates must be imported. However, if the specification can be relaxed, it is possible that transportation costs can be reduced. Recognizing that there might be a trade-off in reduced service life, the designer will need to evaluate the ramifications of this alternative before making the decision. Again, data visualization can be a helpful tool in making an informed decision regarding potential alternatives.
Figure 4 is a map of Iowa that has been geologically interpreted in relation to the specification for the polished stone value. PSV is a key component in maintaining pavement surface friction over a pavement’s service life. The map shows that the areas shaded in green meet or exceed the PSV specification. The black areas are geologically unsuitable for use in projects with a PSV requirement, and the red areas show regions where a marginal reduction in the minimum PSV would permit the use of quarries in those areas. One can see that if the PSV specification is rigorously enforced, the aggregate for virtually all of Iowa will need to be transported from the northwestern corner of the state.
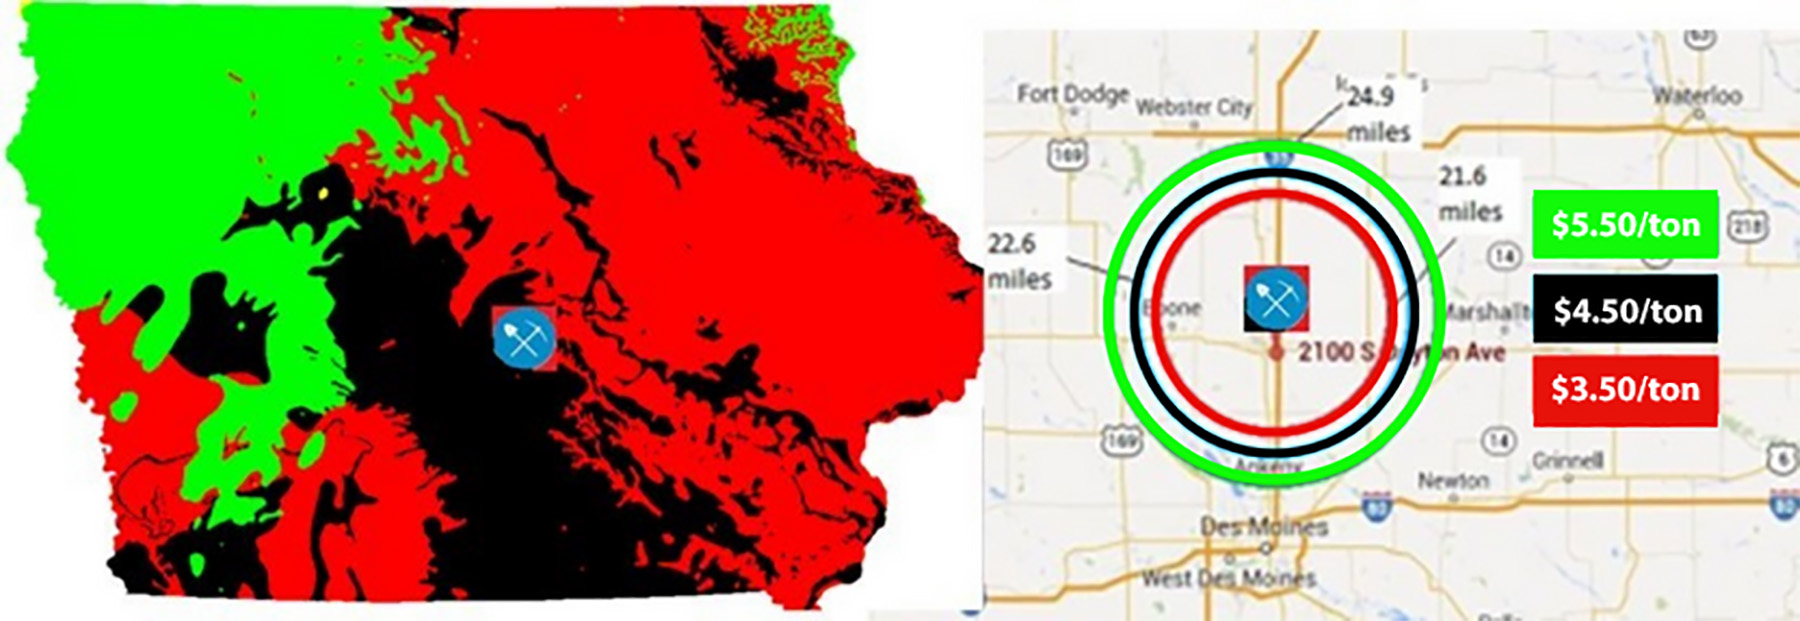
However, if the designer is willing to relax the standard, quarries on both sides of the state become viable sources for aggregate. Transportation costs for a typical project can be reduced because the project can obtain rock from the closest quarry shown in the green and red areas as denoted by the colored rings on the highway map.
Key takeaways
The figures in this article were produced to operate in a standard commercial spreadsheet with the analytical output exported to a commercial GIS platform. Hence, proprietary computer software is not required. Thus, taking available cost data, such as DOT bid tabulations, that are routinely collected permits the creation of a database. The database is used to populate construction cost models using state-of-the-art business data analytics. This approach has been found to be feasible for any private or public agency that is willing to invest the upfront resources to build the database and models.
The benefits of this approach are as follows:
- Visualizing construction cost information for the project location allows the designer to better understand the cost impact of design decisions before they are made.
- By evaluating design alternatives in a geospatial context, the design effort lost is minimized when the project requires changes in scope to remain within budget.
- Resources required to develop alternatives to conventional designs can be justified by potential cost savings.
- Enhanced cost certainty for the owner is achieved by integrating up-to-date unit pricing for a given location.
- The chances that the project’s bid prices will exceed the available funding that prevents contract award are greatly reduced.
- Visualizing geotechnical conditions for specific factors can provide an economic justification for adapting material specifications to reduce transportation costs.
The old cliché that a picture is worth a thousand words is demonstrated by these tools. Instead of having to plow through past project records and use statewide bid average pricing, these data-driven solutions show the impact of design decisions for specific project locations. And instead of processing mountains of tabular data to find the answer, the designer can see it at a glance, making cost-conscious decisions at any stage of the design process.
Douglas D. Gransberg, Ph.D., P.E., F.ASCE is the president of Gransberg & Associates Inc. H. David Jeong, Ph.D., M.ASCE is a professor at Texas A&M University. Nils J. Gransberg, Ph.D., A.M.ASCE, is the vice president of Gransberg & Associates Inc.
This article first appeared in the March/April 2024 print issue of Civil Engineering as “Visualizing the Cost Impact of Design Decisions.”
Want to know more about this topic? Join the authors for a free webinar on Wed., April 17 at 11:30 a.m. ET.