
Ceyda Polatel, Ph.D., P.E., M.ASCE, is an infrastructure and installation resilience engineer for the United States Army Corps of Engineers Jacksonville District and chair of ASCE’s Environmental and Water Resources Institute Surface Water Hydrology Technical Committee. In this Member Voices article, Polatel writes about why labels such as “100-year flood” are technically useful but invite systematic misinterpretation, and what constitutes effective public post-flood messaging. Please note: The views and opinions expressed in this article are those of the author and do not reflect the official policy or position of any agency or employer.
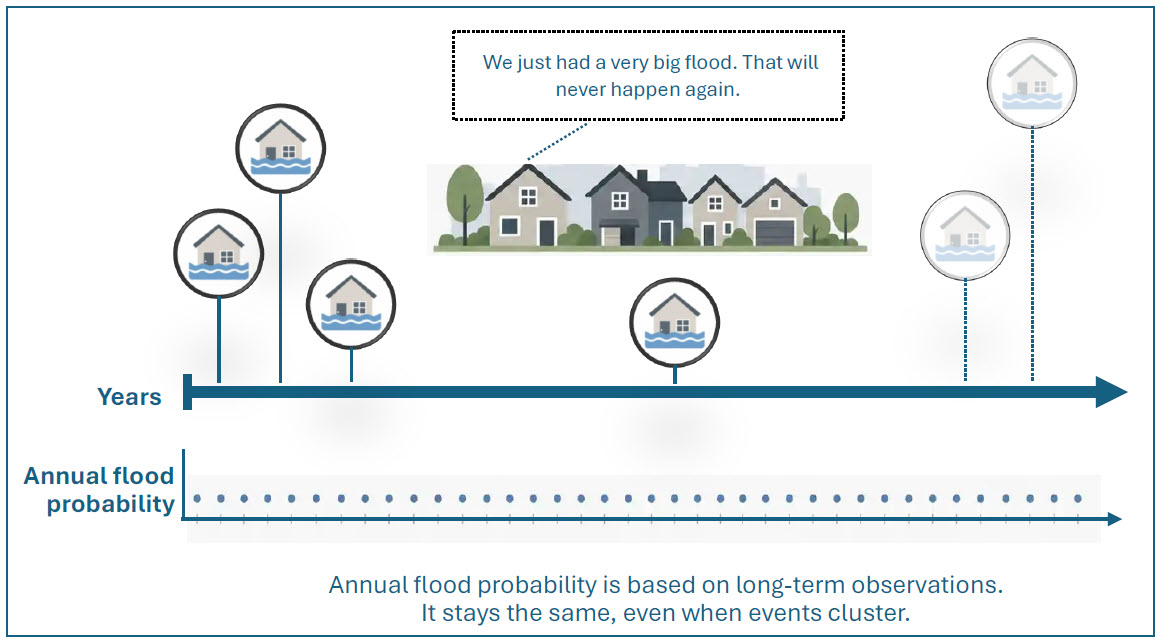
After severe flooding, a familiar phrase often emerges from affected communities: “That will never happen again.”
This sentiment, reported in news coverage and survivor interviews, reveals a disconnect between how engineers describe flood risk and how the public understands it. Engineers speak in probabilities; the public hears schedules. We use the term “100-year flood” to mean there is a 1-in-100 chance that a flood of this depth or greater could occur in any given year, a statistical characterization derived from observed records. Many people hear something very different: a flood that happens once per century, followed by a long period of safety.
This is not about people ignoring advice or engineers neglecting their responsibility for public safety. It is about a statistical framework colliding with human psychology. Engineering tools that describe extreme rainfall and floods typically assume independent yearly probabilities, stationary records, and data-derived return periods.
People, by contrast, rely on stories, recent experience, and intuitive assumptions about how often rare events should occur. The same label, such as “100-year” or “500-year,” means one thing in a hydrology report and something quite different around a kitchen table.
In Florida, where I live, I have repeatedly heard some version of this claim after a major storm: “They said it was a 1-in-500-year event, so we are good for another 499 years.”
That reaction is not rare. It is a predictable response when we frame risk with labels that sound like clocks rather than probabilities. Oral histories from Kerr County, Texas, one of the most flood-prone corridors in the country, show a similar pattern. Residents treated a devastating past flood as evidence that “that will never happen again.” Similar stories recur in many regions as we continue rebuilding in known flood-prone areas while expecting this time to be different.
The way engineers characterize flood risk is statistically sound but poorly matched for communicating with the public. The result is not just a misunderstanding but a systematic misinterpretation. People infer temporal guarantees where none exist and discount repeated experiences. Closing that gap requires more than public education; it calls for reframing the language itself, so it better aligns with how people actually understand risk.
The 100-year flood: Technically powerful, publicly misunderstood
Before considering the drawbacks of the phrase “100-year flood,” let’s first discuss why the term has endured in engineering. Flooding, although common, is difficult to measure and describe statistically. Gauge records are limited in time and space, and floods can vary sharply over short distances and brief periods.
Their time series are noisy and hard to summarize in ways that support engineering design. Hydrologists, therefore, use standardized statistical methods and the associated return period concept to transform complex natural phenomena into numerical descriptors that guide infrastructure design.
“Return period” is a shorthand to describe the probabilities of events occurring in any given year under assumed conditions. Within that technical context, expressions like “100-year event” efficiently summarize very complex observations and data analysis methods. The difficulty begins when the same shorthand leaves that context and enters everyday conversation. Many people hear “once every hundred years” and infer a schedule: if one has just occurred, another should not come soon.
This pattern aligns with what behavioral scientists call “the gambler’s fallacy,” the belief that if an event happens once, it will not happen again soon. Following flooding, people may assume that a major event reduces the near-term chance of another, even though the annual probability remains unchanged and may increase as environmental conditions change.
Flood insurance data show the same tendency, with some households dropping coverage after a large loss, as though they have “paid their dues.” Labels like “500- to 1,000-year event” reinforce this miscalculation. A term meant to describe how far an event lies in the tail of a statistical distribution is often heard as a promise that similar events are unlikely for generations, even in places that have recently seen several extreme storms and floods in quick succession.
Labels that focus on temporal behavior can also obscure other important aspects of flood hazard. They do not reveal how wide an area will be affected, how water will move through a watershed or a city, how fast flows will be, or what depths are likely on particular streets. When we stop at labels like “100-year flood” or “500-year flood,” we highlight an abstract statistical descriptor and leave these hydrologic and hydraulic consequences in the background, even though they most directly shape risk for households and communities.
When we say “100 years,” which years do we mean? Past, present, or future?
The seemingly simple phrase “100-year flood” rests on a large set of assumptions, even when applied exactly as intended. Traditional flood frequency estimates are based on historical records, assuming that the past is a reasonable representative of the future. Rainfall dynamics, land use, land cover, and soil moisture are treated as roughly the same over time. However, those assumptions have been under strain. Rising temperatures, shifting storm patterns, urbanization, and alterations to drainage and storage all affect how often certain flows and depths occur.
A number that once summarized past observations may no longer be a good estimate for future conditions, yet the label “100-year” is static and not designed to reflect how quickly those underlying drivers are changing.
Even if we could hold flood drivers stationary, a “100-year” label still describes only the long-term average behavior while treating each year’s extreme as an independent draw.
In reality, floods in many watersheds are not evenly spread in time; they tend to cluster during periods driven by large-scale weather patterns, with long quiet intervals between. This clustering reinforces the false sense of safety after a busy period has passed.
There is also no broad consensus on how often to update these observation-based estimates or on how to treat very large recent events identified as potential outliers. Let’s consider a gauge with 40 years of record that has just experienced an event previously described as having an annual exceedance probability of about 0.2% (often called a “1-in-500-year” event). Once that extreme value is added to the record and the analysis is repeated, the estimated annual probability for an event of that magnitude might increase to something closer to 0.5% or 0.33% (roughly “1-in-200-year” or “1-in-300-year”), depending on the analysis method and the rest of the observed data. In practice, this can mean that the “500-year” label used during an event may no longer align with updated flood-frequency estimates once the event is added to the data used for statistical analysis.
Research on nonstationary flood and rainfall frequency analysis is growing, and several methods now adjust design values over time using observed and expected trends. But design guidelines, manuals, and common practice still largely rely on stationary approaches with infrequent updates. For the public, none of these nuances is visible. People hear “100-year flood” as if it were a fixed quantity, when, in reality, it is a moving target that depends on how we select, model, and periodically revise the observed record.
Lessons from other hazards
Other hazards are not usually framed in a way that suggests the risk has been used up. Earthquake communication presents long-term probabilities over decades and distinguishes between magnitude and intensity. Magnitude, reported on a moment-magnitude scale, describes the overall energy released by the event, while intensity scales such as the Modified Mercalli scale describe how strongly the ground shakes and how much damage occurs at specific locations. People along active faults may hope for a quiet interval, but the standard language does not suggest that one big quake reduces the chance of another.
Tornado discussions also focus on severity rather than temporal spacing. Forecasts and warnings emphasize the likelihood of strong winds, flying debris, and structural damage, and the most serious situations are labeled with clear, impact-focused terms. In the United States, the Enhanced Fujita (EF) Scale rates events from EF0 to EF5 based on estimated wind speeds and the damage they cause. People in tornado-prone regions may remember quiet or active years, but no one expects a quiet spell simply because a strong tornado just hit.
Flood risk, by contrast, is framed in ways that invite exactly this kind of thinking. Intensity–duration–frequency curves are labeled by return period, and maps show “100-year” and “500-year” floodplains as distinct zones, which can make risk feel like fixed, widely separated tiers. Outreach that stresses improbability, such as “only a 1 percent annual chance,” can then reinforce the idea that once such an event has occurred, it should not happen again soon. The statistics themselves are not wrong. What is missing, compared with earthquakes and tornadoes, is a simple way to describe flood impacts and to name categories by what people are likely to experience, rather than by abstract intervals in time.
Engineering a non-technical flood risk vocabulary
Our familiar language for describing floods was built for a stationary world, and it struggles to capture conditions that are changing within a single lifetime. As methods and standards evolve to account for non-stationarity, our public-facing language can also evolve to better match how people think and decide. Flood terminology itself can be something we design and test, rather than simply falling out of technical analysis.
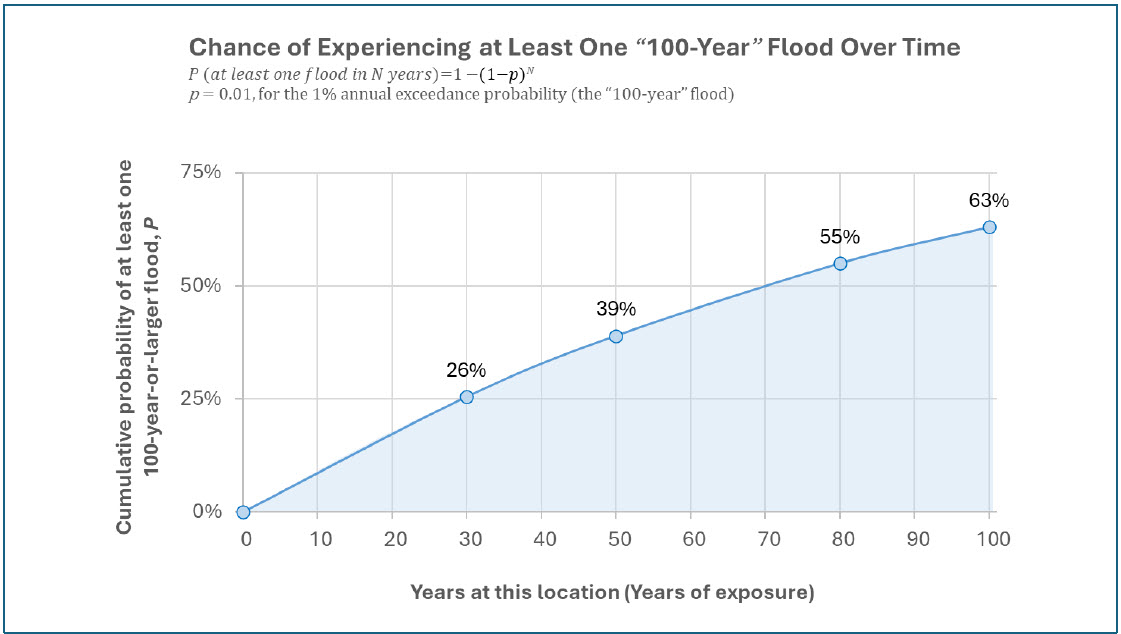
A useful starting point is to more deliberately separate design language from public language. Return periods and intensity–duration–frequency curves remain essential for sizing culverts, levees, and drainage systems and for setting standards, but they do not need to be the primary vocabulary for households. When speaking to residents deciding whether to buy insurance or evacuate, it is more helpful to translate the same information into cumulative probabilities over time horizons that matter for their decisions, such as “about a 1 in 4 chance of flooding during a 30-year mortgage.” This keeps the underlying analysis in place while shifting the emphasis toward actual flood impacts.
Pieces of impact-based language already exist, including stage-based flood categories and warnings that describe which roads, structures, and services are affected. What is missing is a more consistent, shared impact vocabulary that can travel across disciplines, technical products, and outreach materials. In practical terms, that means pairing technical descriptions of flood risk with plain-language labels for use in public-facing documents, so that over time, that vocabulary becomes familiar enough that a resident who hears a flood description knows roughly what to expect at their front door.
Developing that shared vocabulary can’t be an engineering exercise alone. Hydrologists and modelers provide insight into what the numbers can and cannot support, but social scientists, planners, emergency managers, insurers, and community organizations understand how people interpret messages, how trust is built, and how risk information shapes development, land use, and recovery decisions.
The case here is not for a specific set of labels, but for a process: a deliberate, interdisciplinary effort to develop, test, and refine impact-based language. The point is to arrive at an evidence-based, purpose-built vocabulary that describes what people are likely to experience, rather than abstract time intervals.
As we work toward a better vocabulary, there is much we can do in the meantime. We can be explicit that recent flooding does not reduce the chance of future events, and that in many watersheds, those probabilities are rising. Building that message into post-event briefings, community meetings, and summary reports is a direct way to counter the “that will never happen again” narrative and to reinforce that a severe event does not reset the clock. If fewer residents conclude that a devastating flood has exhausted their risk, we will know the language is evolving in a useful direction.
I invite colleagues to share perspectives that could help build a clearer, shared vocabulary for flood risk.
Acknowledgments: The author thanks Carson MacPherson-Krutsky, Gabriel Todaro, Andrew Coman, and Will Veatch for their thoughtful review and feedback.
