By David Jen
United States climate adaptation efforts have expanded in the past few years, continuing a downward trend in national greenhouse gas emissions that last peaked in 2007.
The progress, however, remains insufficient, with the country currently on track to miss its national and international midcentury climate goals, according to the Fifth National Climate Assessment, referred to as NCA5, which was released in November 2023. (Read more about the report in “US emissions decline, but work remains, federal study says,” Civil Engineering Online, Dec. 18, 2023.)
Large-scale changes, such as “rising sea levels, melting ice, ocean warming and acidification, changing rainfall patterns, and shifts in timing of seasonal events,” have already begun to challenge industries and communities in unprecedented ways, according to the report.
But the U.S. Global Change Research Program, the interagency effort responsible for the report, also included help to assist engineers and planners in preparing for this new normal.
Allison Crimmins, the director of NCA5, presented two data-visualization tools at the ASCE Inspire 2023 conference in November: the NCA Interactive Atlas tool and the Climate Mapping for Resilience & Adaptation tool. Both will be useful to engineers as they design projects.
NCA Interactive Atlas
Atlas enables users to drill down to the county level to view climate projections and sea-level rise maps. The interactive online tool presents the entirety of the data supporting NCA5, as opposed to just what could fit in the report, says Crimmins.
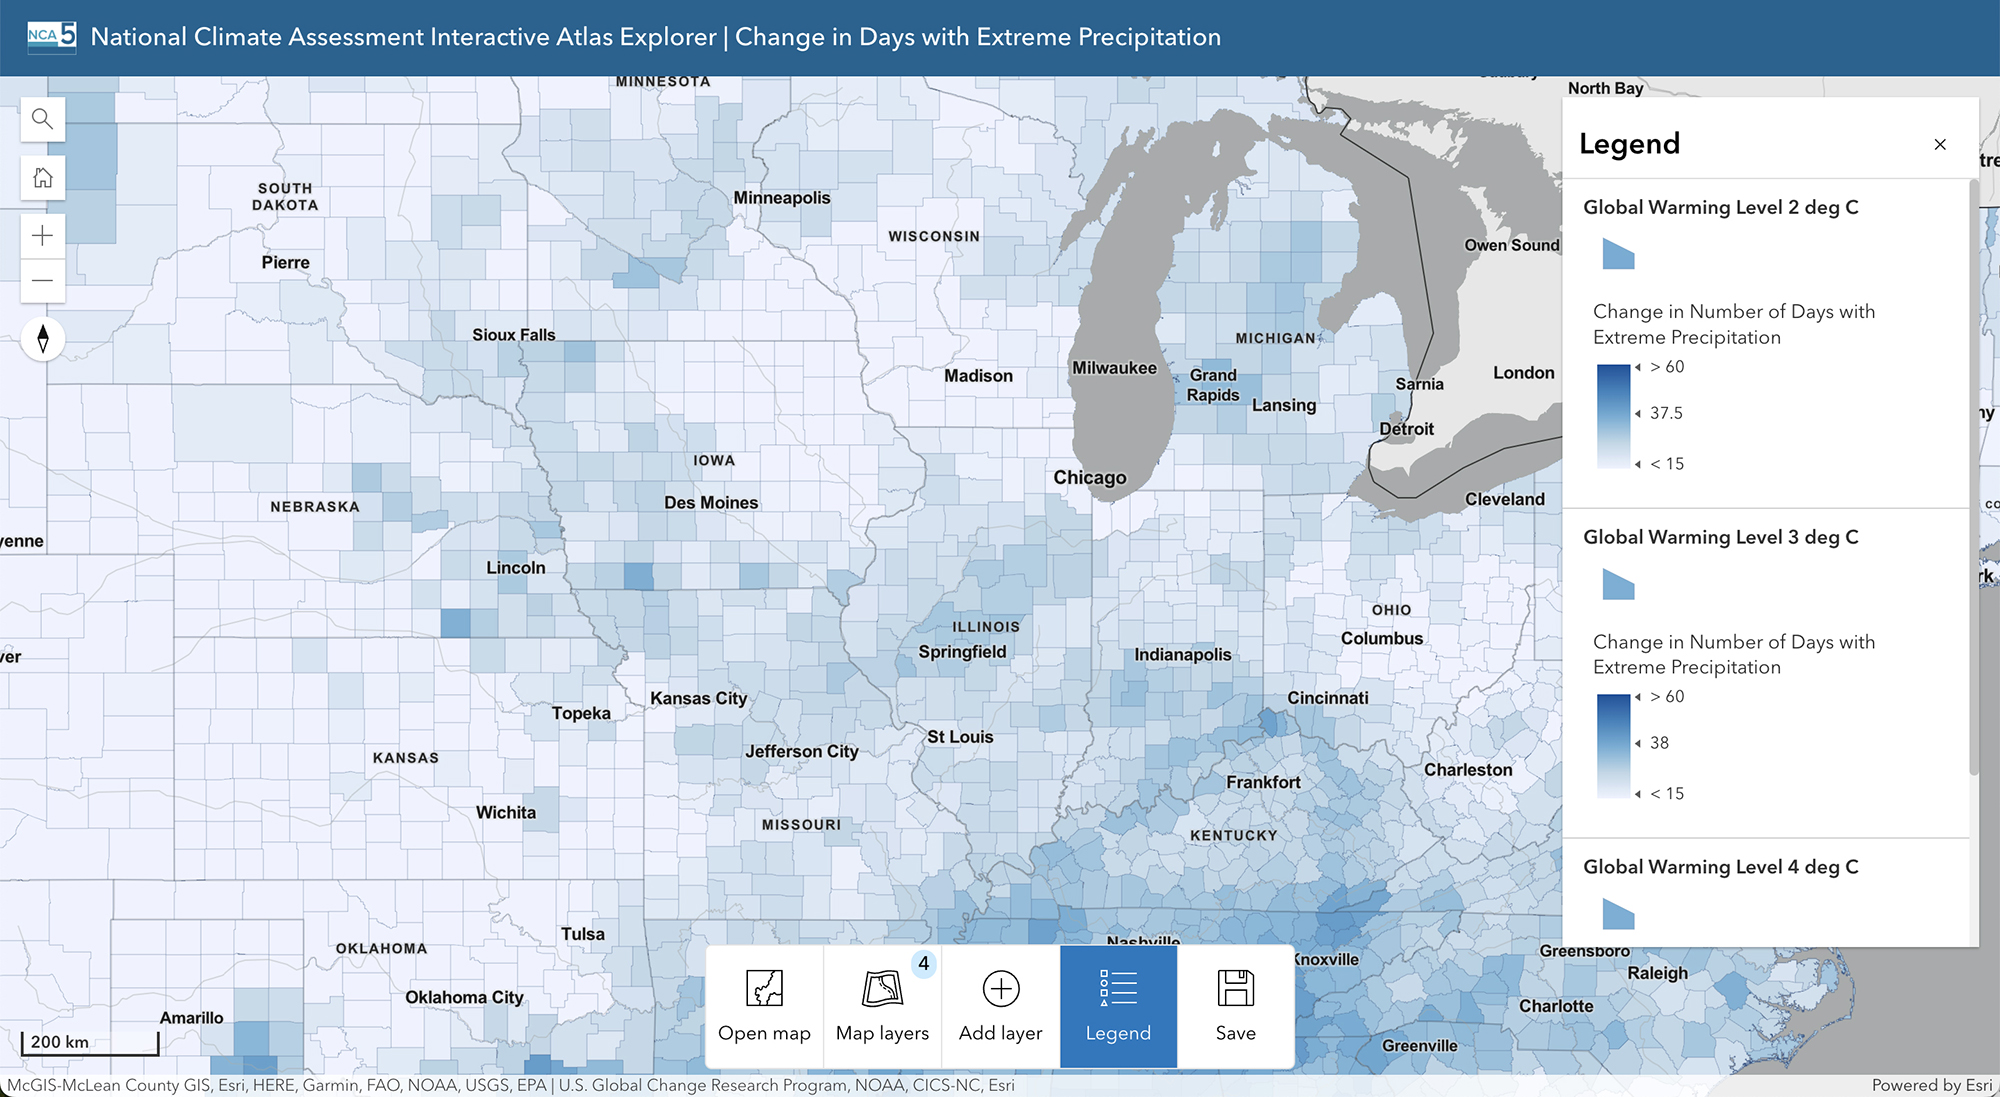
“If you're a water utility manager in Chicago and you need to know how much more rain is projected to fall on the wettest day of the year because you need to understand how to build your utilities so that you're not getting sewage overflows into the city, this is a great tool to understand that data and zoom right into where you need it,” says Crimmins.
Atlas will soon also include weather data for parts of the country outside the contiguous U.S.
Climate Mapping for Resilience & Adaptation
The second tool, CMRA, overlaps somewhat with Atlas in that both allow users to slice NCA5 data in the form of climate maps. CMRA, however, drills down to the census tract level and includes other datasets, such as the National Risk Index, the National Oceanic and Atmospheric Administration’s Billion-Dollar Weather and Climate Disasters, and funding resources, says Julian Reyes, Ph.D., USGCRP’s deputy director for services.
“It's a little bit more about getting folks in the door with data, but then getting them to some financial technical resources,” Reyes says.
In addition to the NCA datasets, CMRA presents data around extreme heat, drought, wildfire, flooding, coastal inundation, and extreme cold. (Atlas focuses on temperatures and precipitation).
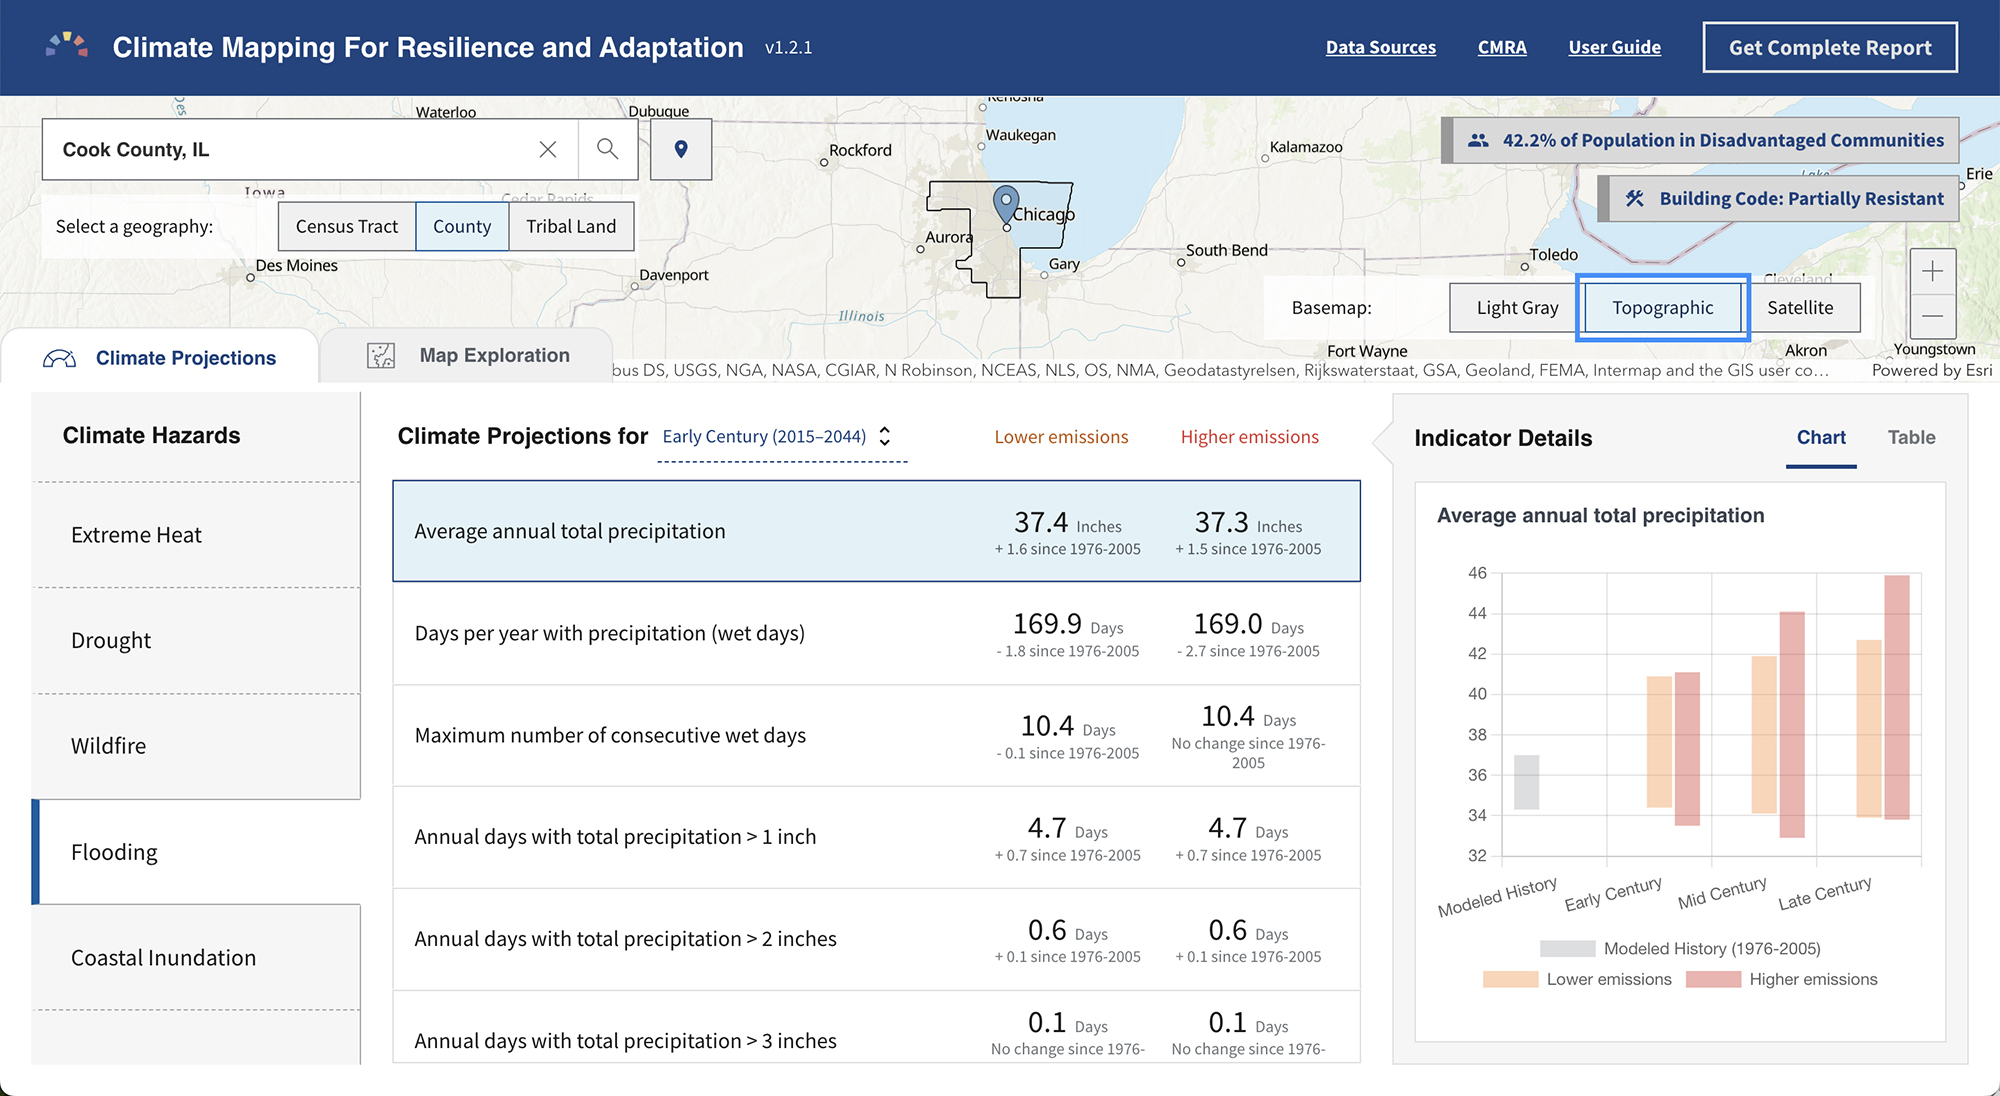
For state, local, tribal, and territorial governments, CMRA makes connections between the climate data and federal opportunities, climate adaptation plans, and support for nature-based solutions.
Building for the future
Overall, the NCA5 report emphasizes a need to move from an incremental mindset to a more transformative one, says Crimmins. With that in mind, engineers must ask big questions early on, at the planning level.
Part of the power of the tools lies in their ability to help visualize spatial and temporal components.
While the first question is, of course, “Are we building it?” Crimmins says, the second question should be “Where are we building it?”
Designing projects not only for where they sit in space, but also in time, will also become more and more important as the effects of climate change ramp up, which the mapping tools can help with, says Reyes.
Air-conditioning systems, for example, could be appropriate based on a project’s location, but Reyes also urged engineers to look “into the future at the entire range of what could be expected, not (just based on) the past.”
Crimmins sees existing specifications that are already unable to meet the needs of new climate realities, perhaps most prominently in transportation infrastructure, where train rails have buckled, streets have warped, and airplane takeoff distances have elongated under extreme heat conditions.
Climate realities have changed faster than we thought they were going to, she says, and as a result we’re seeing damage to infrastructure.
Water-intensive industries, such as agriculture and municipal water systems, also have had to adapt to more rain and drier droughts as a result of climate change.
Back on target
National mitigation targets and international temperature goals require a minimum average GHG reduction of 6% per year compared with the 1% average annual decline seen between 2005 and 2019, according to the NCA5 report.
Crimmins appreciates how the report has moved past the prior conversation “explaining that climate change was real” and on to “these great case studies of communities around the country who are already taking actions, whether that's mitigation or adaptation action or some combination of both.” Much of that shift has been the result of climate-related risks and damages appearing more regularly.
She therefore reiterates the need for planners and engineers to treat the main problems and not the symptoms. Instead of raising houses in response to flooding, entire cities and transportation systems could potentially need redesigns, for example.
“We're walking, but we need to be running,” she says.
This article is published by Civil Engineering Online.