By Jay Landers
As the effects of climate change become more pronounced over time, droughts and floods are expected to increase in intensity, while sea levels rise and the threat of storm surges grows. In the face of these dangers, civil engineers are working to devise solutions that will maintain water supplies, reduce flood risks, and protect coastal communities and infrastructure from rising sea levels.
In the coming decades, climate change is expected to have profound implications for societies around the world. Among the most significant is the extent to which climate change will affect water and its distribution across the planet. Shifting precipitation patterns, for example, are expected to increase drought and threaten water supplies in some areas while boosting rainfall in other areas, potentially exacerbating flooding. Confoundingly, some locations likely will boomerang between the two extremes, enduring extended drought as well as periods of greater flooding.
Meanwhile, sea levels are anticipated to rise as glaciers melt and warming oceans expand. And higher sea levels mean greater storm surges, only increasing the violence of dangerous storms.
Each of these changes represents a major challenge to civil engineers, whether they ensure that adequate water supplies are available when and where they are needed or they protect the safety and well-being of individuals and property from the dangers of flooding. How these challenges are met will go a long way toward determining whether individuals, communities, and nations enjoy future prosperity or declining standards of living.
This article, part of the magazine’s series about making infrastructure more resilient to climate change, examines current and future threats to U.S. water resources from drought, the dangers to urban areas and dams from higher floods, and the growing risks to coastal areas from rising sea levels. The article also looks at solutions that civil engineers and others are devising to address these problems before they cause intractable harm.
GDP to suffer
Between 2022 and 2050, “droughts, floods, and storms could result in a total loss of almost $5.6 trillion” to the combined gross domestic product for seven countries around the world representing different climate types, according to a report released in August by the global professional services company GHD. Titled Aquanomics: The economics of water risk and future resilience, the report examines the risk of water-related losses to Australia, Canada, China, the Philippines, the United Arab Emirates, the United Kingdom, and the U.S.
Among the seven nations, the U.S. faces the largest risk by far. By 2050, the country could suffer a total loss to its GDP of $3.7 trillion as a result of droughts, floods, and storms, the report states. Such losses equate to an average annual GDP loss of 0.5%.
At $1.1 trillion in GDP losses, China stands to lose the most after the U.S. Next is Australia, at $312 billion, followed by the U.K. ($153 billion), the Philippines ($124 billion), Canada ($108 billion), and the UAE ($27 billion). The estimated losses represent the potential effects of water-related risk on five key economic sectors: agriculture, banking and insurance, energy and utilities, fast-moving consumer goods and retail, and manufacturing and distribution.
Aridification and the southwest
Throughout the past two decades, most of the western United States has endured significant drought conditions. California, the most populous U.S. state, has had no shortage of drought-related problems, including reduced surface and groundwater supplies, strained agricultural operations, and an increase in wildfires.
Despite the chronic drought conditions, the state has continued to receive its share of flood events. For example, Death Valley, one of the driest places in North America, experienced a flood in early August that had an estimated annual exceedance probability of 0.1%, or a 1,000-year flood, according to a National Park Service news release that cited the National Weather Service.
Southern California, in particular, has experienced a “sharpening in precipitation” in which the frequency of both extreme dry and wet events has been increasing, says Natalie Collar, Ph.D., Aff.M.ASCE, a senior hydrologist for the water resource, environmental, and civil engineering firm Wright Water Engineers Inc.
“That has to do with strong low- and high-pressure anomalies over the northeastern Pacific Ocean, which enhance the storm track coming in toward California,” Collar says. “Often, the locations experiencing extreme drought are also seeing increases in the frequency of high-intensity rainfall.”
That said, the American West will likely see an overall drying trend as a result of climate change, Collar says. “We are anticipating an increase in air surface temperatures, and that is going to drive an increase in what we call the vapor pressure deficit, or the atmospheric demand for water vapor,” she says. “Hotter air can hold more water, leaving less of it on the ground to run off into streams and rivers and to recharge groundwater supplies.”
Resulting increases in plant transpiration and evaporation will exacerbate the already ongoing process of aridification, which is particularly pronounced in the southwestern states, Collar notes. Furthermore, aridification will reduce soil and plant moisture in many forested areas, which could increase the frequency and intensity of wildfires.
In turn, recently burned slopes are often more prone to erosion, meaning postfire rainfall events often boost the amount of sediment entering water bodies. This can degrade aquatic ecosystems, impair drinking water quality, and reduce storage space in reservoirs, Collar says.
Recharging stormwater
Capturing stormwater and recharging it to the local aquifer is one way that the San Bernardino Valley Municipal Water District, in San Bernardino, California, intends to stretch its available water supplies in the face of future drought conditions. A regional water wholesaler, Valley District supplies water to retail agencies in southwestern San Bernardino County, roughly 60 mi east of Los Angeles.
Typically, local surface and groundwater supplies meet 70%-75% of the Valley District’s annual water needs, while the remaining 20%-25% comes from imported water purchased from California’s State Water Project, the massive system of reservoirs, pipelines, and canals that transfers water largely from the northern segment of the state to its more populous southern portion, according to Wen Huang, P.E., the chief engineer and deputy general manager for the Valley District.
However, these percentages can vary greatly in a given year, particularly as a result of fluctuations in the availability of imported water, says Huang.
Given the sporadic nature of its imported water, the Valley District is looking to stormwater as its latest water supply option. “We want to capture (stormwater) and make that part of our water supply portfolio to increase our local water supply reliability,” Huang says.
To this end, Valley District — along with its partners, the Western Municipal Water District, the city of Riverside Public Utilities, and the San Bernardino Valley Water Conservation District — is conducting a two-phased effort known as the Santa Ana River Enhanced Recharge Project. Ultimately, the project will enable the diversion and recharge of up to 80,000 acre-ft/year of stormwater flows from the Santa Ana River.
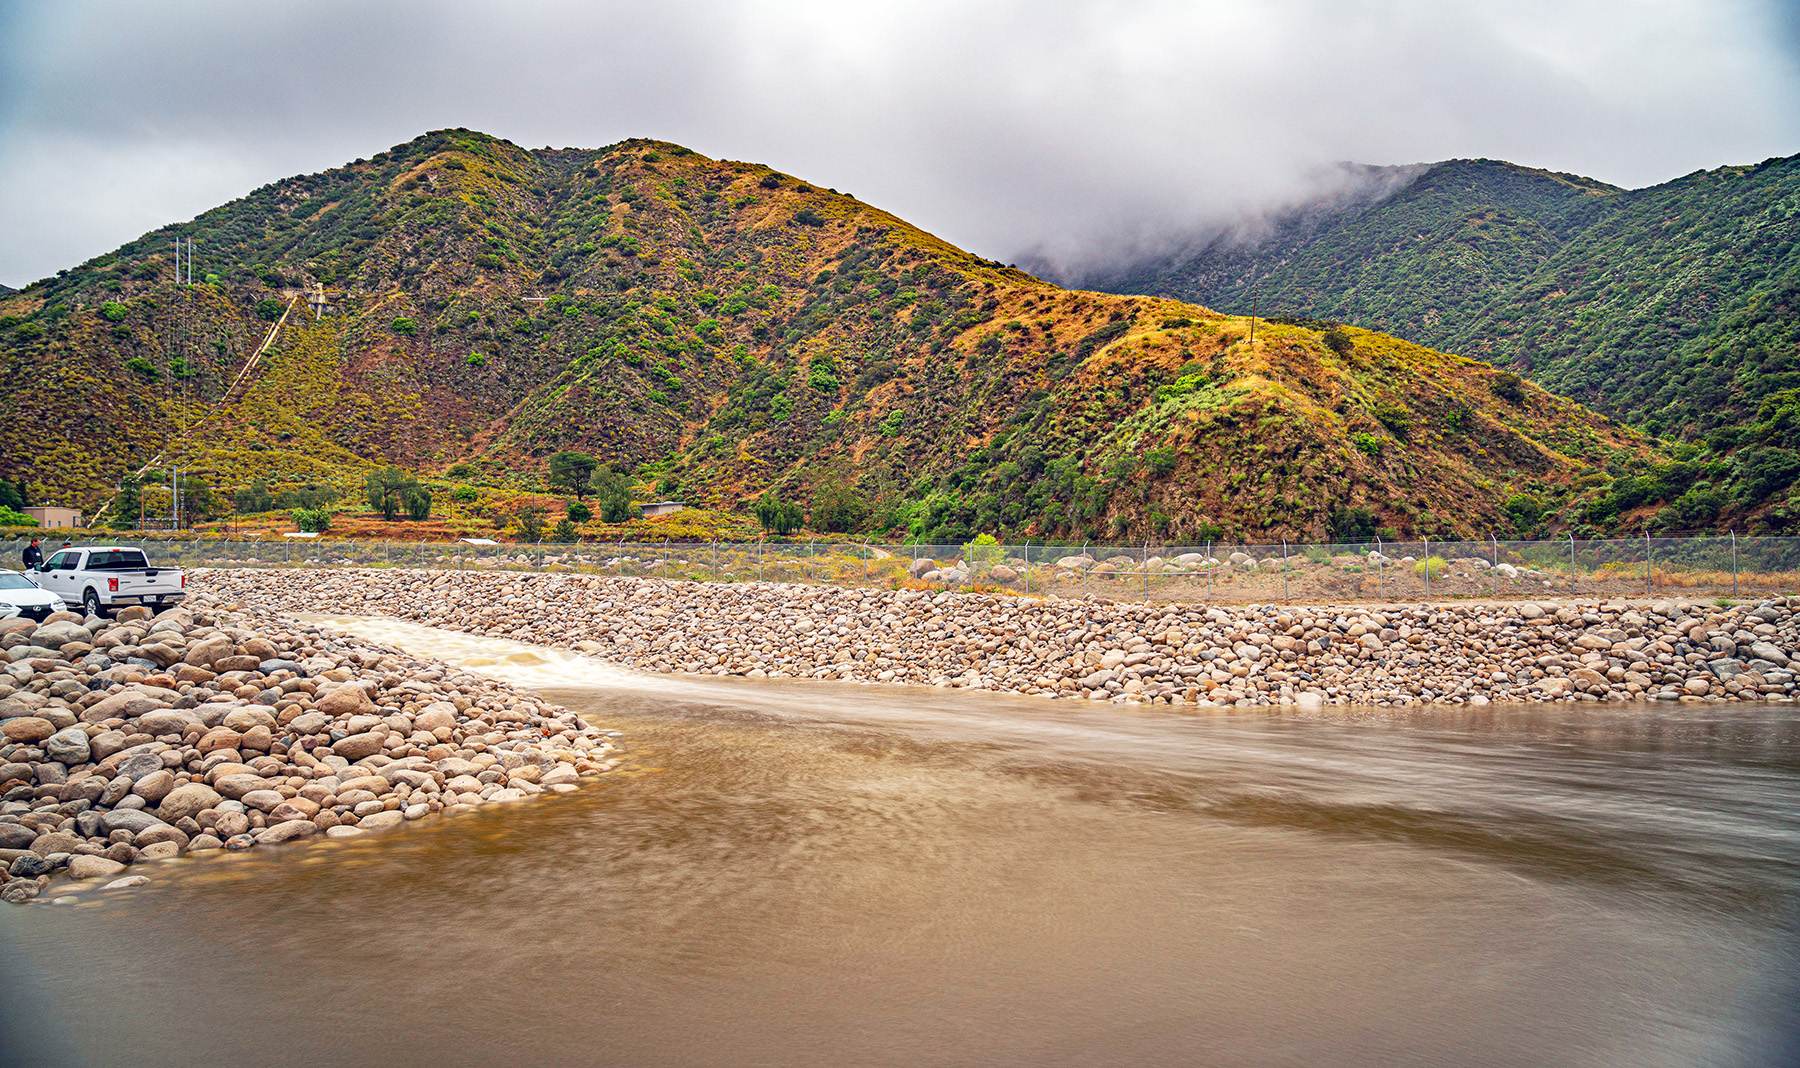
Completed in 2018, phase 1A of the project entailed the addition of a sedimentation basin and other improvements to an existing 105-acre groundwater recharge facility that is owned and operated by the San Bernardino Valley Water Conservation District. Located in the city of Highland, the recharge basins are immediately downstream of Seven Oaks Dam, a flood control dam on the Santa Ana River.
Phase 1B of the project will include the addition of trash removal facilities to the existing intake system, the construction of 337 acres of new recharge basins, and the extension of an existing canal by 6,800 linear ft.
In its current state, the groundwater recharge facility can accommodate up to 195 cfs. Following the completion of phase 1B, the facility will have the capacity to divert and discharge up to 500 cfs from the river. In an average year, the facility will recharge about 15,400 acre-ft into the San Bernardino Basin, a key source of groundwater for local retail water agencies during times of drought.
Estimated to cost $60 million, the phase 1B project received $2 million in grant funding in January from the U.S. Bureau of Reclamation as part of its Drought Response Program. Construction will begin in March 2023 and take about two years, Huang notes.
Improving urban ‘sponginess’
With their vast amounts of impervious surfaces, urban areas face growing flood risks as precipitation events increase in intensity. In some cases, existing drainage infrastructure is overwhelmed by stormwater runoff volumes that exceed their design capacity, resulting in flooding that can range from nuisance to catastrophe.
Greater adoption of practices variously known as green infrastructure or low-impact development can help cities address such problems by capturing and managing rainfall closer to where it lands. Ideally, such measures will complement existing gray infrastructure by reducing runoff volumes entering urban drainage systems.
In recent years, this concept has been pursued aggressively in China as part of a campaign to create “sponge cities,” or urban areas specifically designed to include myriad natural features that enable a city to absorb rainwater at rates much higher than in a typical city. This concept was deployed during the development of new cities in China, making the job much simpler than having to retrofit existing urban areas, says Vincent Lee, P.E., M.ASCE, the Americas East civil and water leader for Arup, a global sustainable development consultancy.
“If you’re building a new city, you can plan for the spaces that you want to absorb and maintain and manage stormwater,” Lee notes.
However, deployment of green infrastructure typically involves the more challenging task of retrofitting existing cities. In many cases, ground conditions, space constraints, existing utilities, and pedestrian and vehicle traffic can limit where such features may be deployed, complicating the process of installing them at scale, Lee says.
To help cities better understand where and the extent to which they could implement more natural features, Arup created a digital land-use analysis tool called Terrain that assesses the “sponginess” of urban areas, Lee says. Employing machine learning and automation, Terrain can rapidly examine large amounts of data and satellite imagery to create detailed land-use maps and calculate the percentages of different land uses in a given area. These results, in combination with an assessment of an area’s soil types and runoff potential, are used to determine the current natural absorbency of a given area.
New era of flood mapping
Harris County, Texas, is famously prone to flooding. Home to the city of Houston, Harris County is a low-lying region with multiple waterways, and it also happens to be near the Gulf of Mexico. In this century alone, the nearly 1,800 sq mi county has experienced two of the worst flood events in U.S. history.
In 2001, flooding caused by torrential rains from Tropical Storm Allison resulted in 22 deaths and more than 70,000 flooded structures, per the Harris County Flood Control District’s website.
In 2017, Hurricane Harvey dumped more than a trillion gallons of water across the county in four days, causing widespread flooding that killed 37 people in Harris County — another 33 people lost their lives elsewhere — and damaged more than 150,000 structures in the county, according to a 2018 HCFCD report.
More than half the Harvey-related deaths in Harris County occurred outside the designated 100- and 500-year floodplains, indicating just how extensive the flooding was, according to the April 2018 article “Brief communication: Loss of life due to Hurricane Harvey” in the journal Natural Hazards and Earth System Sciences.
However, this fact also led some county residents to question the validity and utility of the floodplain designations depicted on official flood maps, says Ataul Hannan, P.E., the planning division director for the HCFCD. “That creates mistrust, like we’re saying the map is wrong,” Hannan says. “But truly, the map doesn’t show all (flood) risk.”
For one thing, existing flood insurance rate maps depict risk associated with riverine and coastal flooding but not urban flooding caused by stormwater runoff. “That picture is missing,” Hannan says. At the same time, the flood risk associated with approximately 900 mi of waterways in Harris County has yet to be assessed completely. “If you go to many places around the United States, including Harris County, not all channels have been identified with risk,” Hannan says.
To improve awareness of all flood risks within its jurisdiction, the HCFCD, together with the U.S. Federal Emergency Management Agency, began an approximately $25 million effort in 2019 known as the Harris County Modeling, Assessment, and Awareness Project, or MAAPnext. Using advanced modeling techniques and the latest data, the agencies aim to create flood maps and other flood-risk tools for Harris County that are the most comprehensive and complete in the nation.
“Our goal is to present to people a picture of risk that will help them to make decisions” regarding how best to protect themselves and their property from flooding, Hannan says. The findings also will inform future strategies for managing growth, development, and flood mitigation within the county.
To this end, MAAPnext is using highly detailed topographic data obtained from lidar and surveying in 2018, historical storm data, data regarding completed flood-reduction projects, current data regarding local impervious surfaces and land use, and the most up-to-date data regarding rainfall depth, frequency, and duration for Harris County.
All this information is used to populate 1D and 2D models developed by the Hydrologic Engineering Center of the U.S. Army Corps Engineers. The 1D model excels at depicting conditions within defined channels and calculating head loss from bridges, Hannan says. By contrast, the unsteady-state 2D model accurately depicts shallow, urban flooding caused by rainfall that has yet to enter a channel.
The combined results of the models enable the HCFCD to estimate the flood risk for every 3 m by 3 m grid area across the entire county, providing a much more detailed, granular assessment of flood risk than has been possible to date. “From an engineering standpoint, this is actually the beginning of a new era of mapping,” Hannan says.
Using the modeling results, the HCFCD developed new flood insurance rate maps and other flood-risk products, all of which were submitted to FEMA for its review in February. Upon FEMA’s approval, which Hannan says is expected in early 2023, FEMA will release the preliminary maps to the public. The HCFCD will then launch an intensive communications campaign to educate the community about its findings.
Aging dams, new challenges
Climate change also is expected to have major effects on dams, both in terms of their operation as well as their physical condition. For some dams, the rules for how their reservoirs are operated may need to change as well.
“Based on the climate change projections we have today, we may be facing longer droughts and more frequent, intense storms,” says Carmen Bernedo, P.E., D.WRE, M.ASCE, the senior principal civil engineer for energy and industry at the global engineering firm Stantec. “Therefore, current reservoir operational rules may not be suitable for managing these changes in the water that flows into the reservoir.”
In the face of changing climatic and meteorological conditions, “reservoir management needs to be agile,” Bernedo says.
At the same time, these changing conditions raise questions about the extent to which existing dams can meet the resulting challenges. “Climate change increases the risk of flooding and even dam failure during periods of extreme precipitation,” Bernedo says. Earthen embankment dams, in particular, are “most likely to be vulnerable to climate change,” she notes.
Along with the increased potential for erosion, dams will experience more fluctuations in reservoir water levels and prolonged drying during hot weather conditions, both of which can exacerbate such problems as cracking and joint movement. “Dam and spillway retrofitting is one of the first options we need to think of when we want to come up with a mitigation or solution for climate change,” Bernedo says.
Additional problems could arise as larger flood events necessitate the use of spillways that, in many cases, are several decades old and have never been used before. “They may have never been tested for large hydrologic loading conditions,” Bernedo says.
Another concern regarding aging dams and their spillways is that, in some cases, they were designed to accommodate probable maximum flood conditions that have since grown in volume and peak flow, Bernedo says.
A PMF is a design flood that results from the most severe combination of key meteorologic and hydrologic conditions that are reasonably expected to occur in an area. PMF estimates, in turn, are based on probable maximum precipitation estimates. In its Engineering Guidelines for the Evaluation of Hydropower Projects, the U.S. Federal Energy Regulatory Commission defines a PMP as “theoretically, the greatest depth of precipitation for a given duration that is physically possible for a given size storm area at a particular geographic location at a certain time of year.”
However, if a region’s records do not include large storms, or if such storms have increased in size since the original PMP estimates were made decades ago, then the PMP estimates for some older dams may no longer reflect current conditions, Bernedo says.
An increase in the volume or peak flow of a PMF for a given dam could spell trouble. “We’re going to be testing these conditions that we’ve never seen because we didn’t have these large floods,” Bernedo says. “We may encounter problems.”
By retrofitting or enlarging dams, or at least their spillways, those dams will be “able to pass larger floods that are the product of climate change,” Bernedo notes.
Insufficient no more
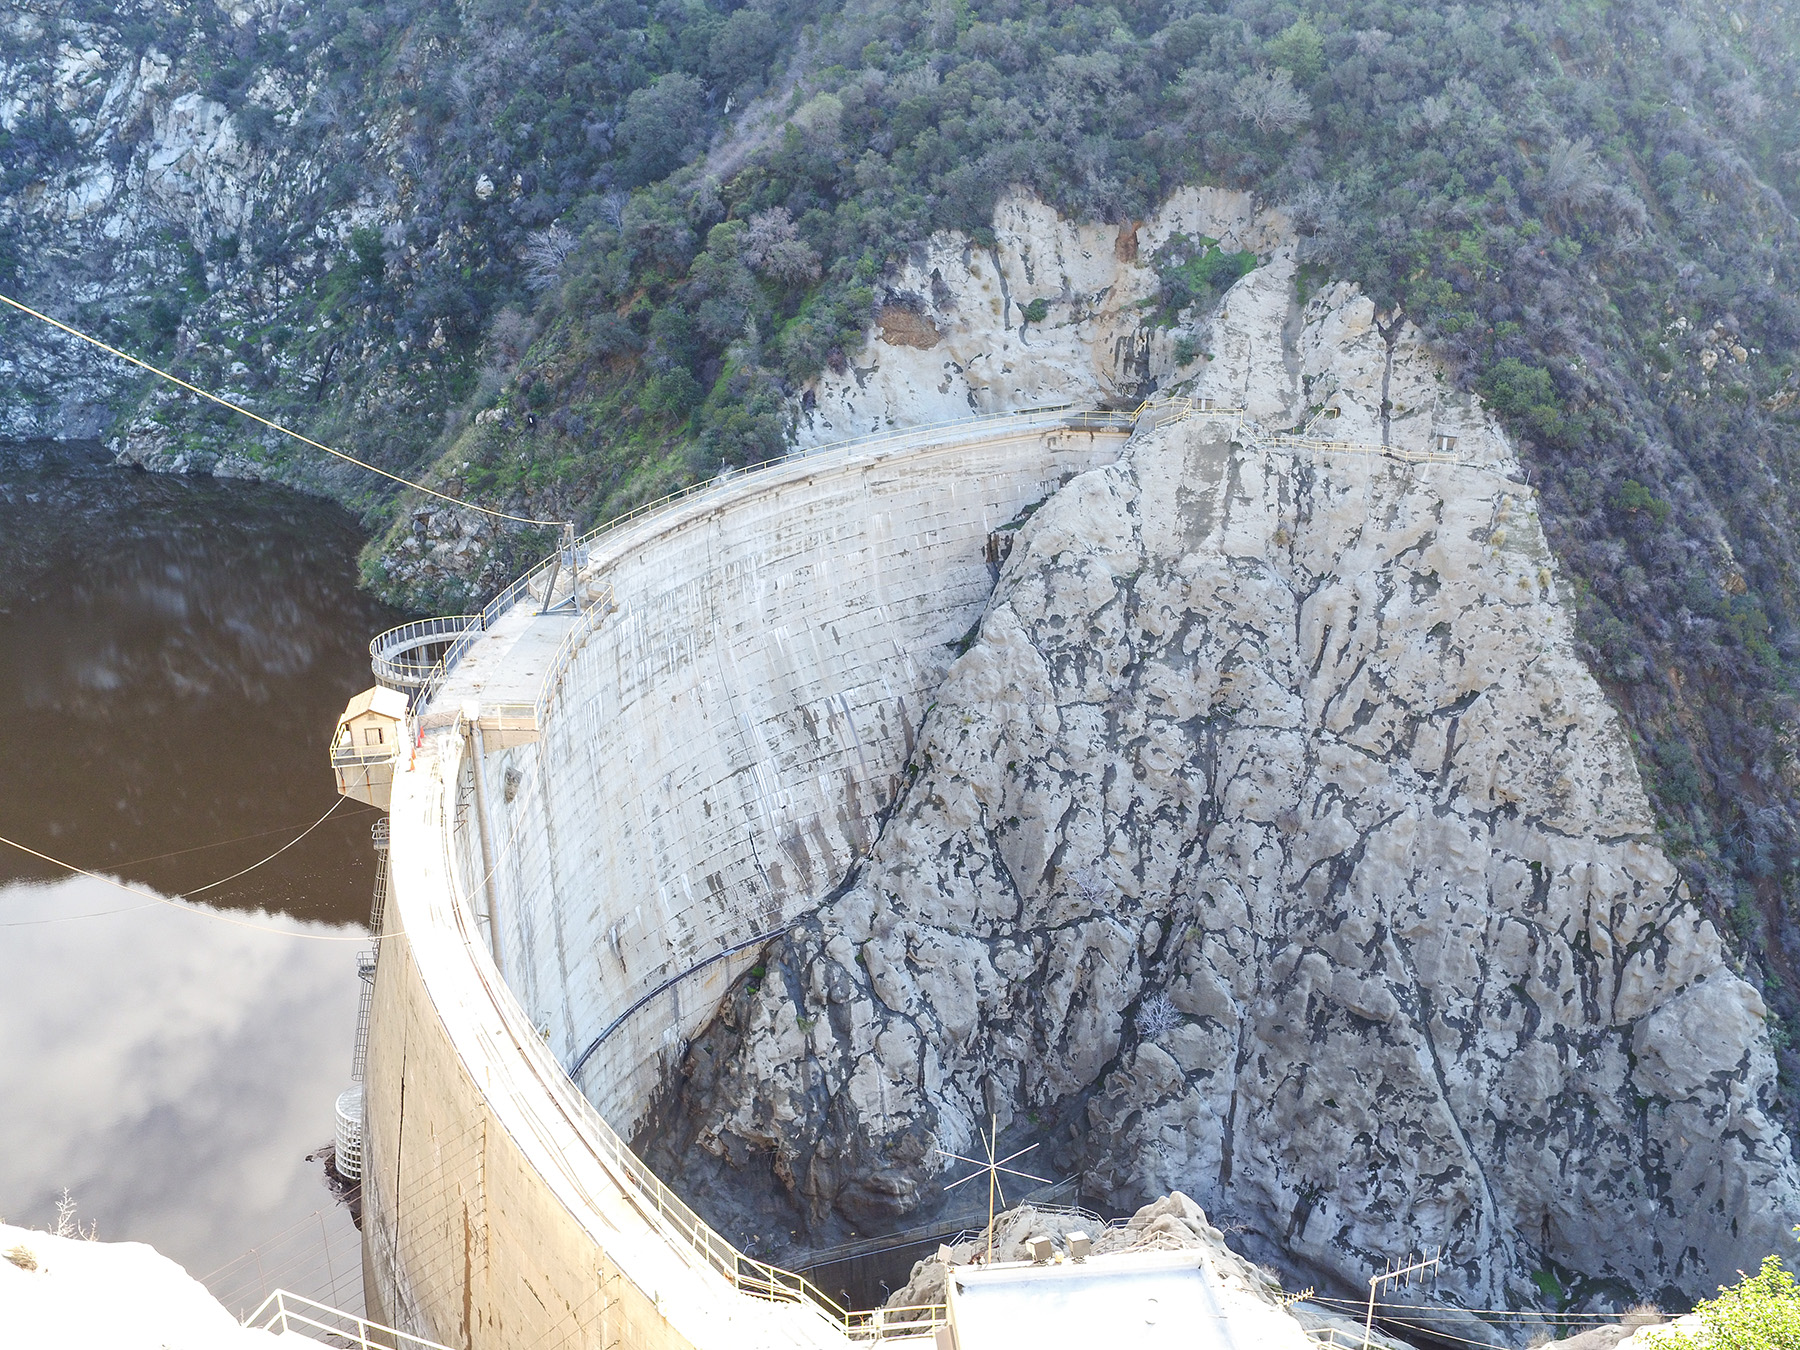
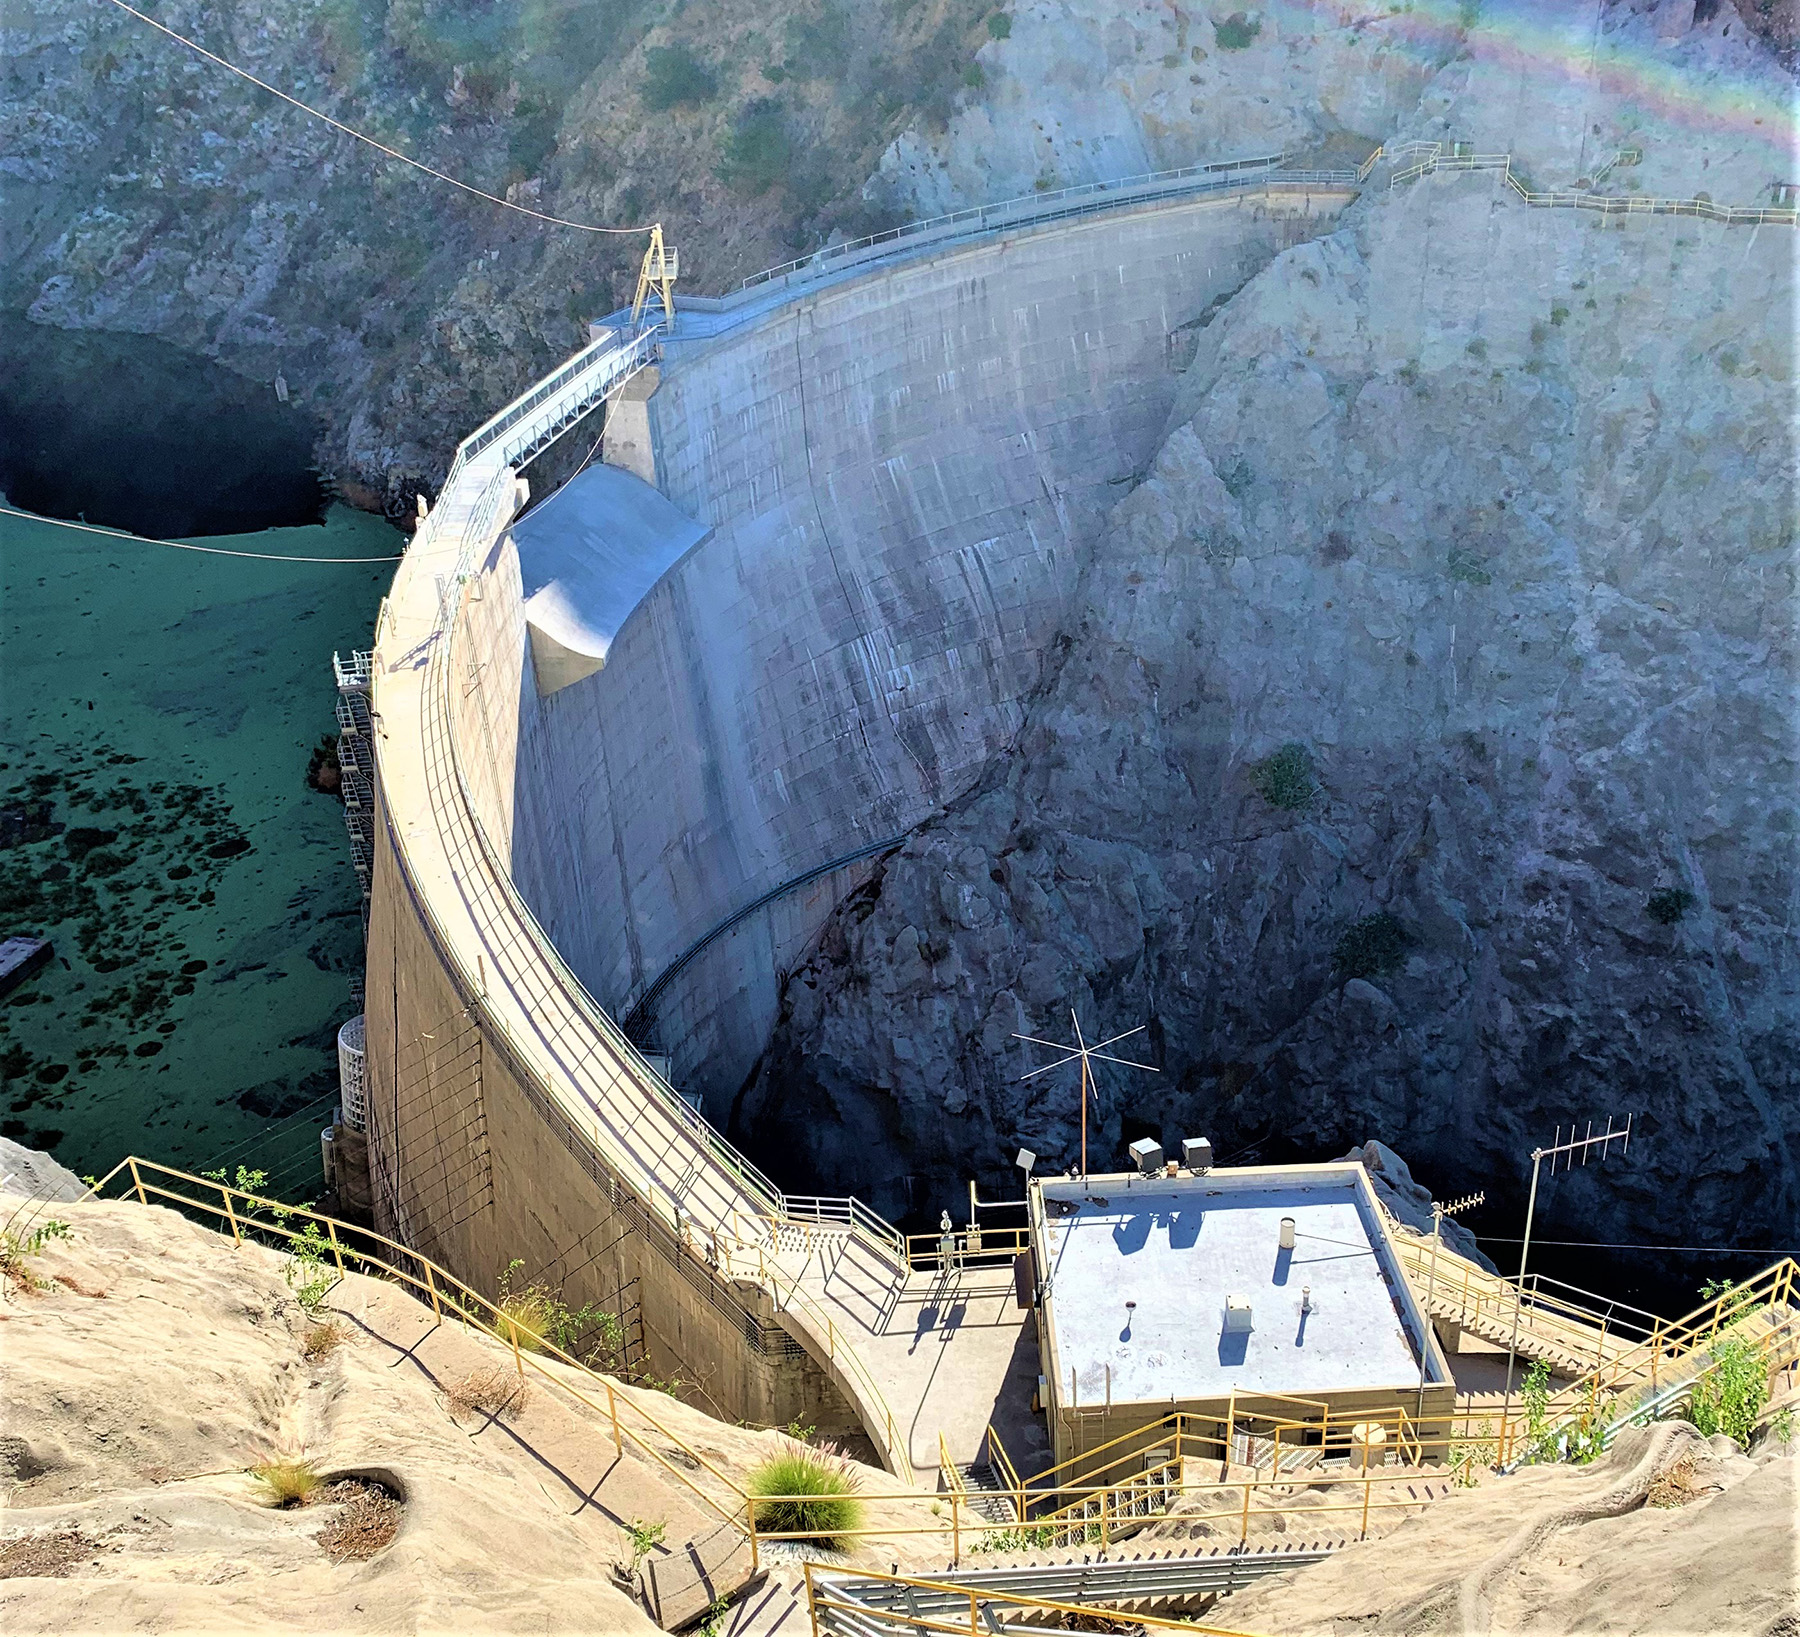
One such dam that recently underwent an expansion of its spillway is the Santa Anita Dam. Owned and operated by Los Angeles County, the 225 ft high, 612 ft long dam is in the San Gabriel Mountains, approximately 15 mi northeast of downtown Los Angeles.
The Santa Anita Dam “was originally constructed in 1927 with a single covered spillway channel with a hydraulic capacity of 2,900 cfs,” says Mark Pestrella, P.E., M.ASCE, the director of Los Angeles County Public Works. “In 1947, an auxiliary semicircular weir spillway and a crest spillway were built, bringing the total capacity of the three spillways to 4,900 cfs.”
However, hydrologic and hydraulic studies conducted by Public Works and the California Department of Water Resources’ Division of Safety of Dams in the late 1990s and early 2000s revealed that the original spillways were not adequate to pass the PMF inflows of 26,100 cfs, Pestrella says.
Although the odds of such an event occurring were small, the consequences could have been dire. “A dam failure could result in the uncontrolled release of the reservoir,” Pestrella explains. “This would inundate communities downstream of the dam, causing property and environmental damages and (the) potential for the loss of life.”
The finding regarding the dam’s insufficient spillway capacity eventually led to the Santa Anita Dam Spillway Modification Project, which was completed in October 2021 at a cost of $34.7 million. Designed by Stantec and constructed by the Kiewit Infrastructure West Co., the project included construction of a “new spillway capable of passing the probable maximum flood to mitigate flood risk for downstream communities and to comply with state dam safety standards,” Pestrella says.
“A 74 ft wide by 40 ft deep notch was cut near the center of the dam’s arch,” according to Pestrella. “A reinforced-concrete ogee spillway was constructed within the notch. In constructing the new spillway, the auxiliary semicircular weir and crest spillway were removed.”
Following the modifications, the spillway can release 27,000 cfs. “With completion of the Spillway Modification Project, the dam meets current seismic and hydraulic standards established by the DSOD,” Pestrella notes.
Resist, restore, retreat
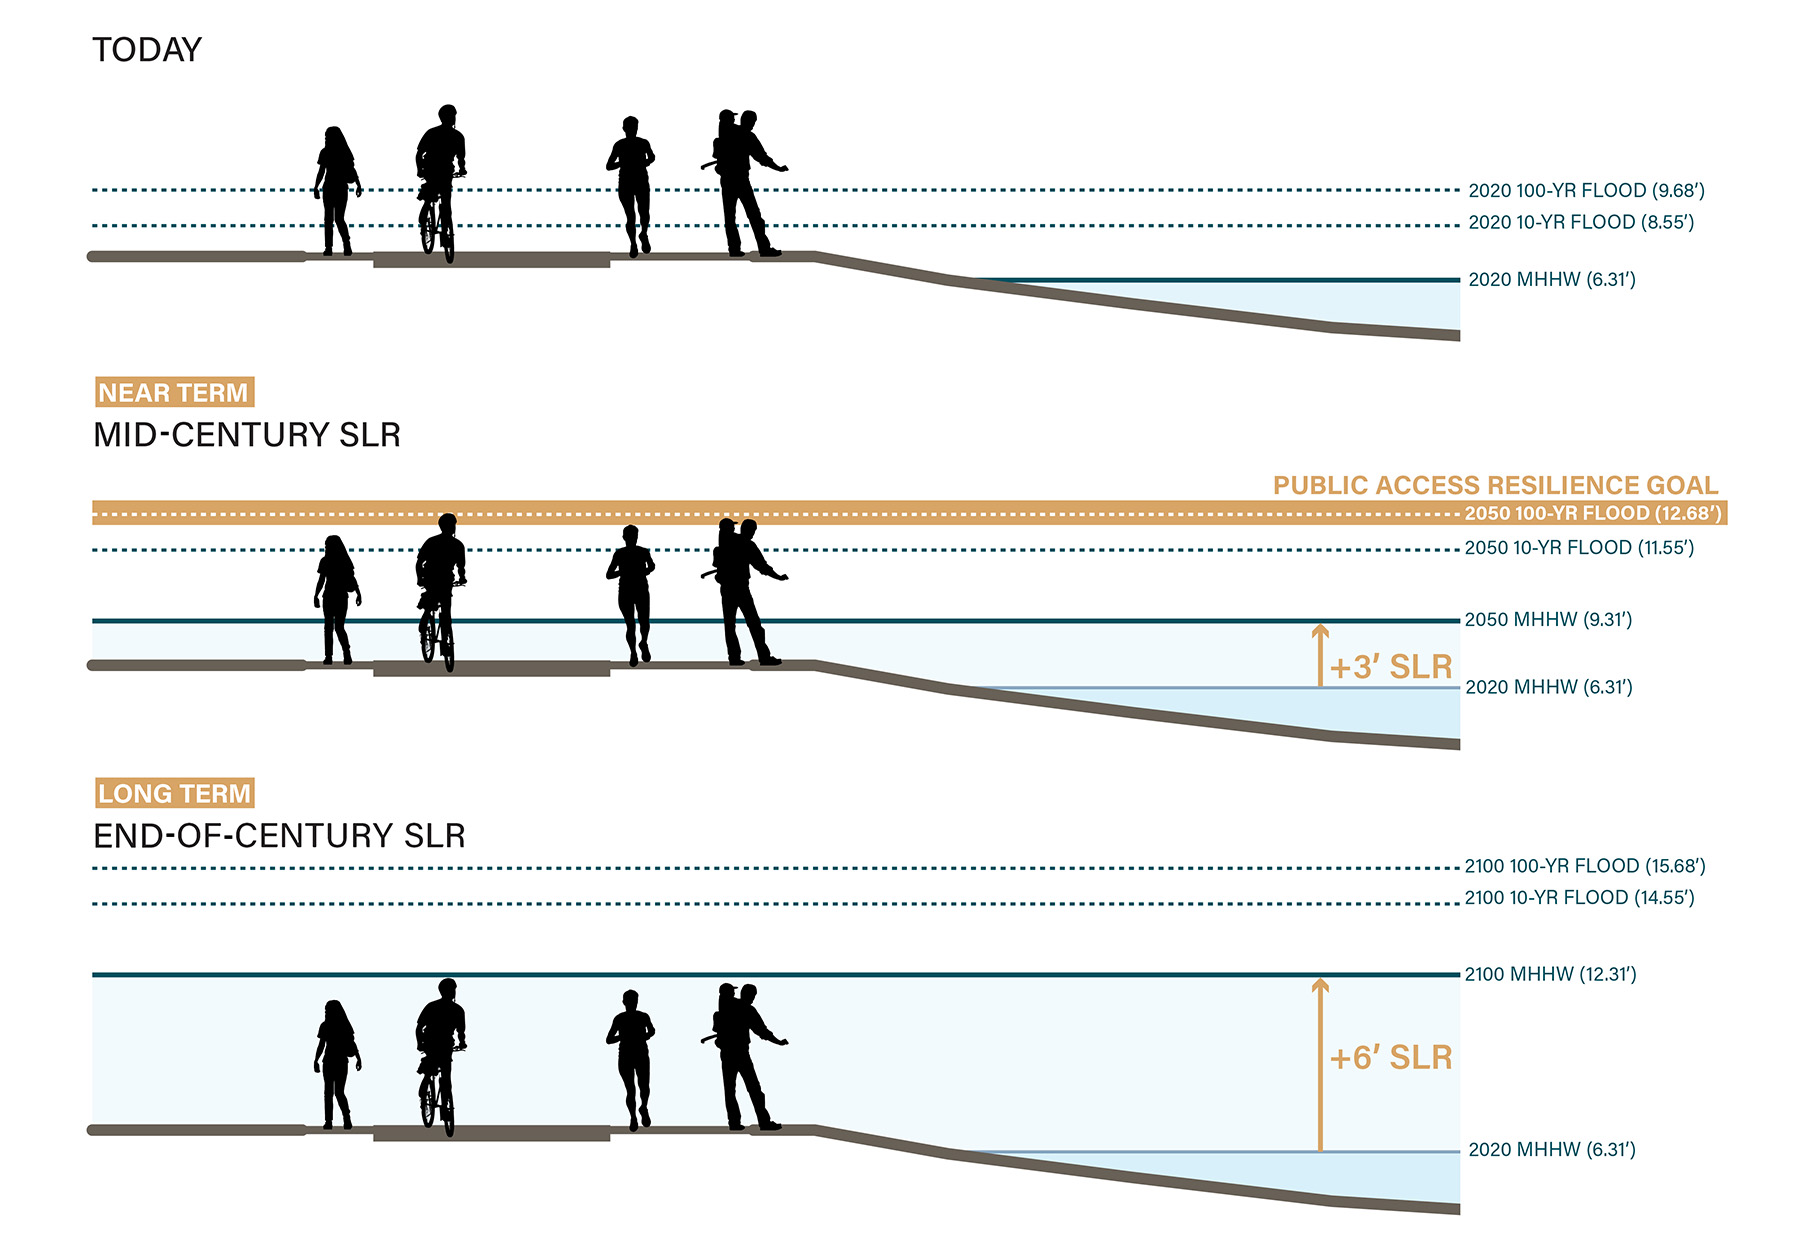
For coastal areas, climate change is expected to bring the dual challenge of sea level rise and higher storm surges. Confronted with these threats, anyone looking to increase the resilience of a structure or location near a coast generally has three broad options, says Jack Hogan, P.E., an associate climate risk and resilience engineer at Arup. They are “resist, restore, or retreat,” Hogan says.
Whereas the resist approach relies on such traditional methods as sea walls and levees to hold back water and protect communities and critical infrastructure, the restore approach relies on nature-based solutions, including wetlands, to provide a buffer against sea level rise and storm surge. As its name implies, the retreat approach entails “pulling back from the shoreline” in cases in which “it may be better off to allow that space to be flooded in the future,” Hogan says.
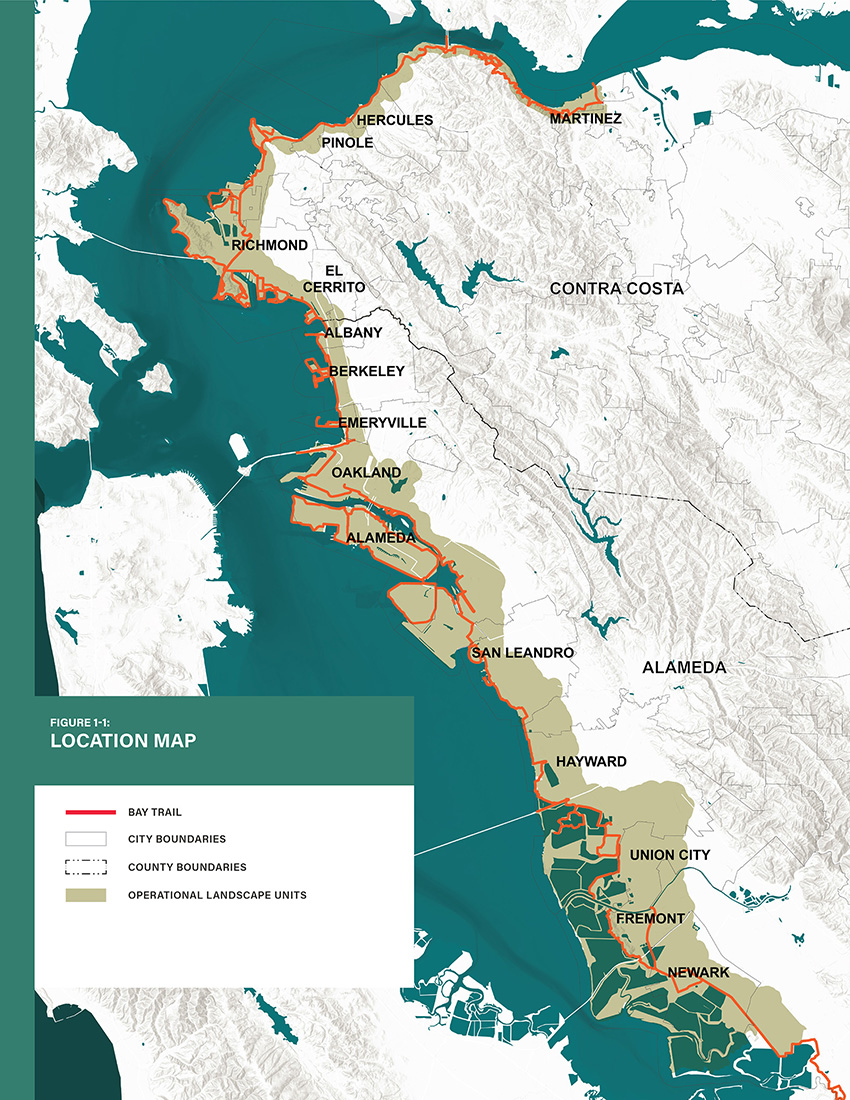
A detailed understanding of a site’s current and historical conditions is needed to tailor appropriate approaches to improve its resilience, Hogan says. In the San Francisco Bay area, for example, such assessments benefit greatly from the existence of the San Francisco Bay Shoreline Adaptation Atlas, a 2019 publication of the San Francisco Estuary Institute and the San Francisco Bay Area Planning and Urban Research Association.
The Adaptation Atlas divides the Bay shoreline into 30 operational landscape units, or physically similar geographic areas, and notes the types of approaches best suited to increasing resilience for the various units. “It’s a really clean way of doing a typology or archetype assessment for a large shoreline area like that,” Hogan says.
A ‘road map’ for protection
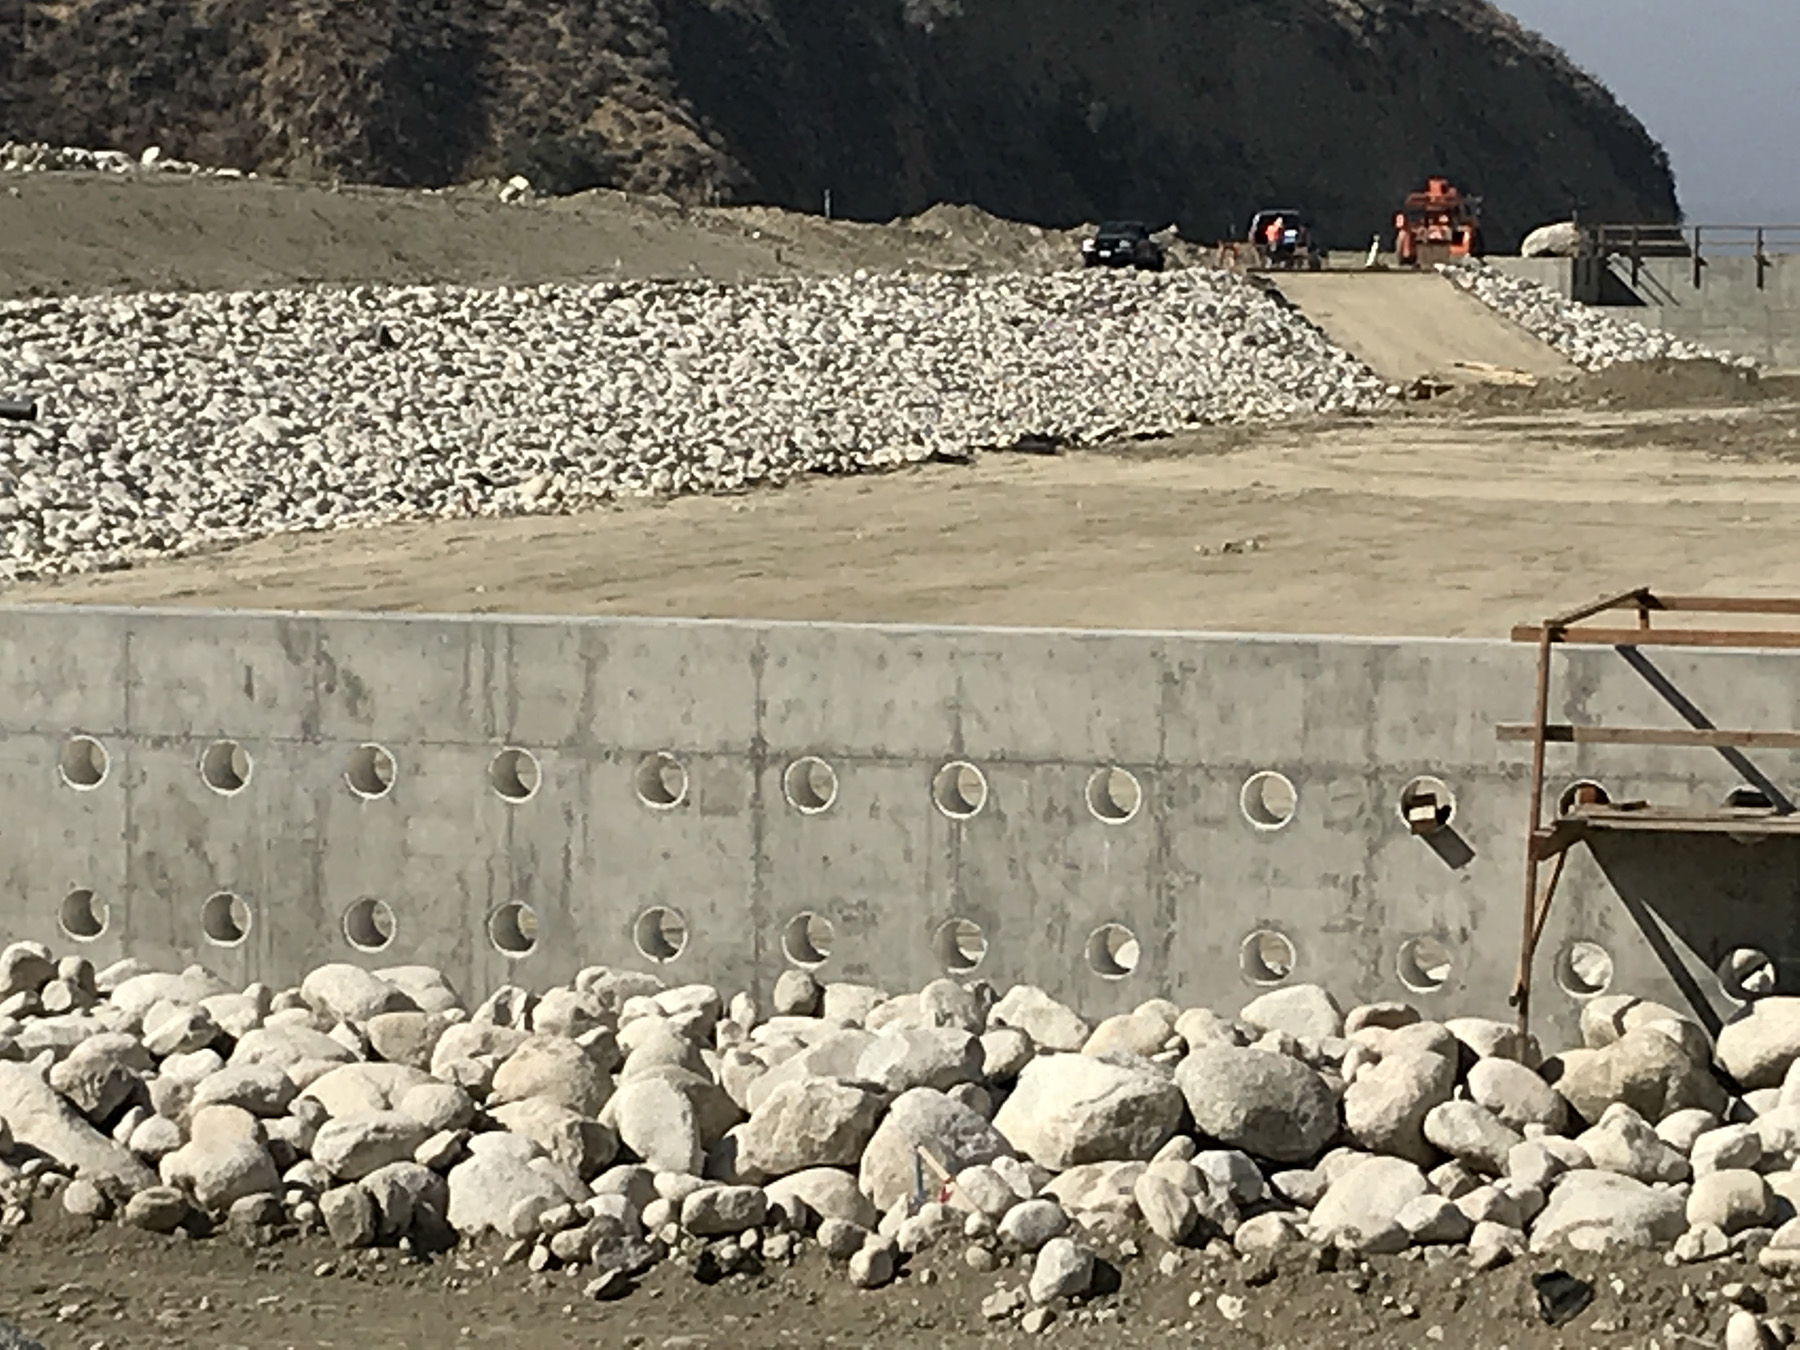
Arup recently contributed to an ambitious project that aims to address sea level rise across a wide swath of the eastern region of the San Francisco Bay Area. Known as the San Francisco Bay Trail Risk Assessment and Adaptation Prioritization Plan, or RAAPP, the effort involved assessing sea level risks along a more than 50 mi stretch of East Bay shoreline within Alameda and Contra Costa counties and prioritizing sites for future adaptation projects.
As part of a consultant team led by WRT, Arup provided services related to risk assessment, climate adaptation, and infrastructure systems. The other members of the consultant team were ESA, the San Francisco Estuary Institute, and OnClimate.
The East Bay Regional Park District, the sponsoring agency for the RAAPP, released the plan in April 2021. Responsible for 125,000 acres of parkland in Alameda and Contra Costa counties, East Bay Parks owns or manages 55 mi of the San Francisco Bay Trail, a network of hundreds of miles of trails that ultimately are planned to encircle the entire Bay.
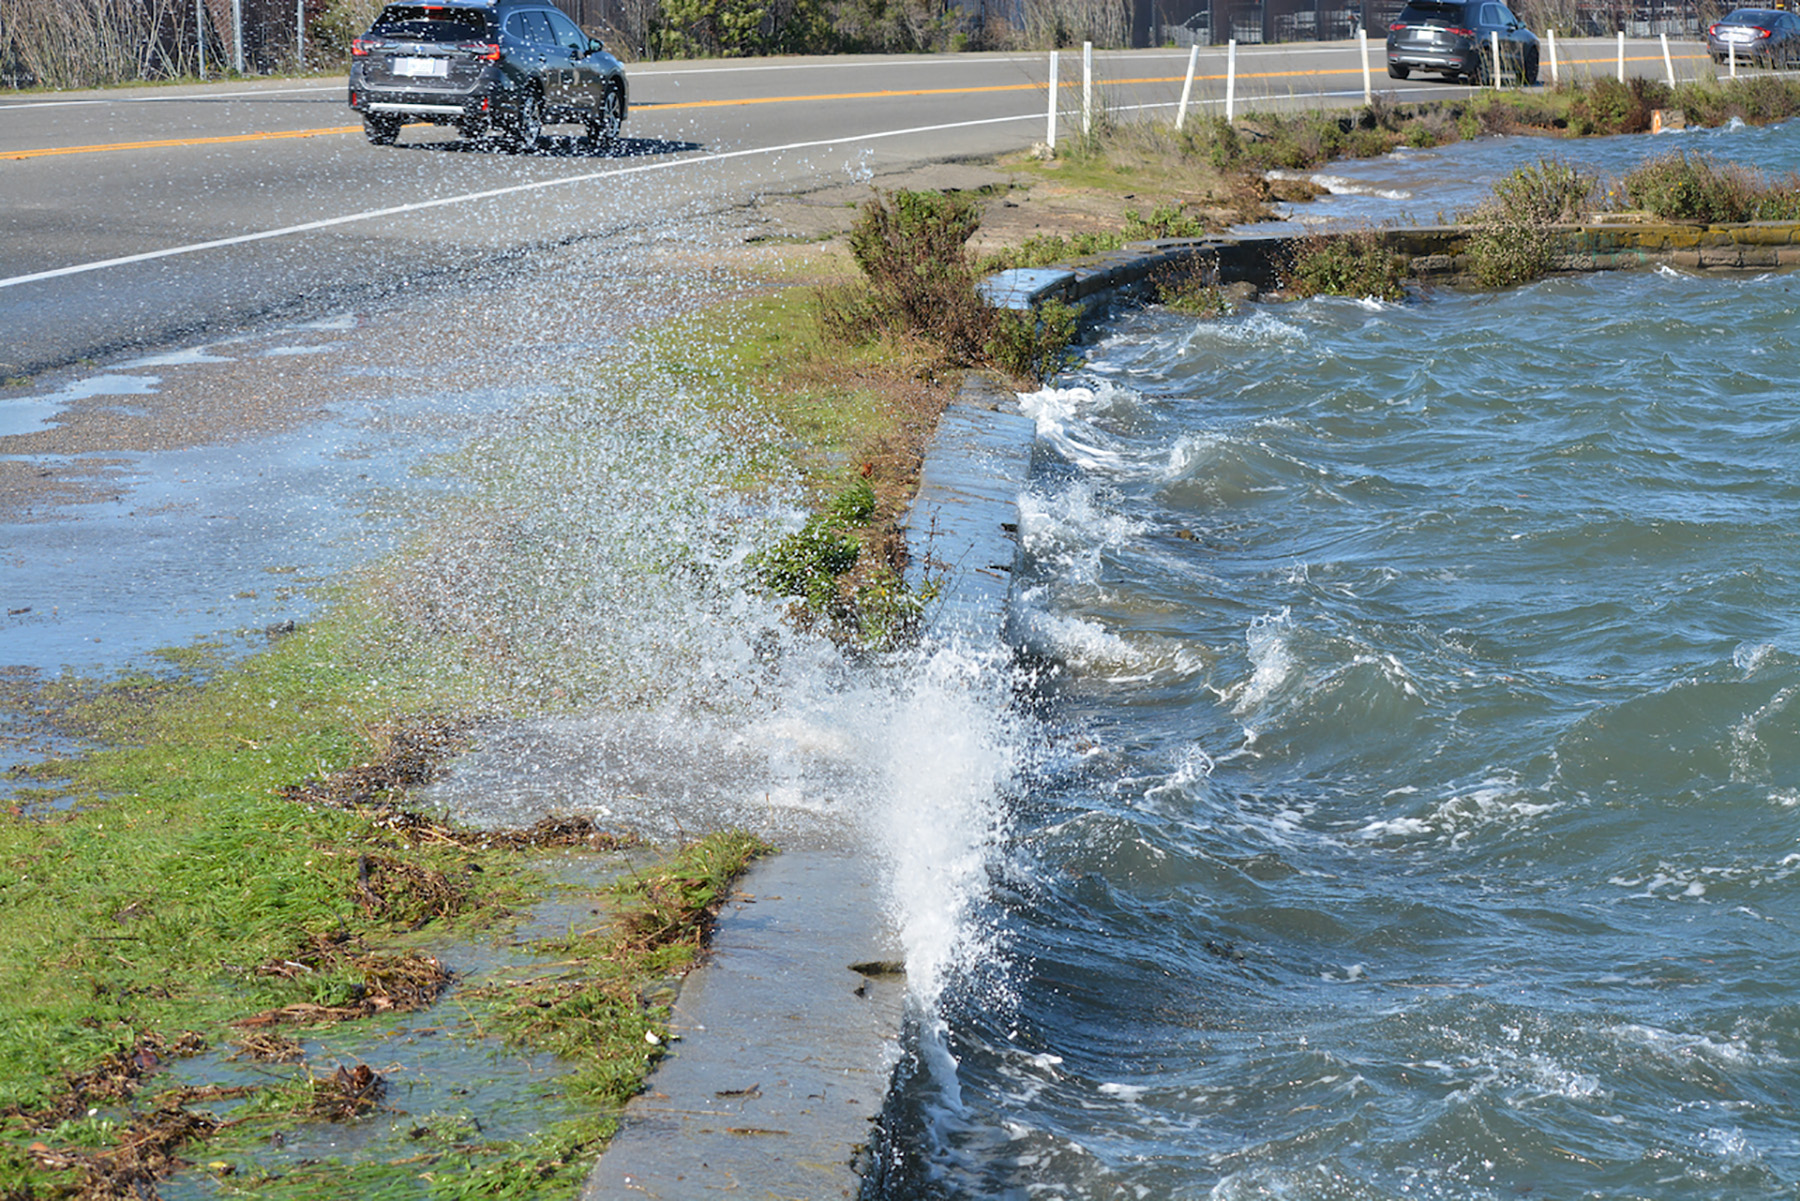
Because its portions of the Bay Trail extend along the East Bay shoreline, East Bay Parks is “very attuned to sea level rise,” says Brian Holt, the district’s chief of planning/geographic information systems. Already, some low-lying sections of the trail experience flooding during so-called king tides, or periods when tides are higher than normal.
As a region, the Bay Area is “very good at understanding what the challenges are” regarding sea level rise, Holt says. “There’s been a fair amount of high-level thinking on what an adaptation response might be. But there hasn’t been a lot of focus on what actually might be implemented.”
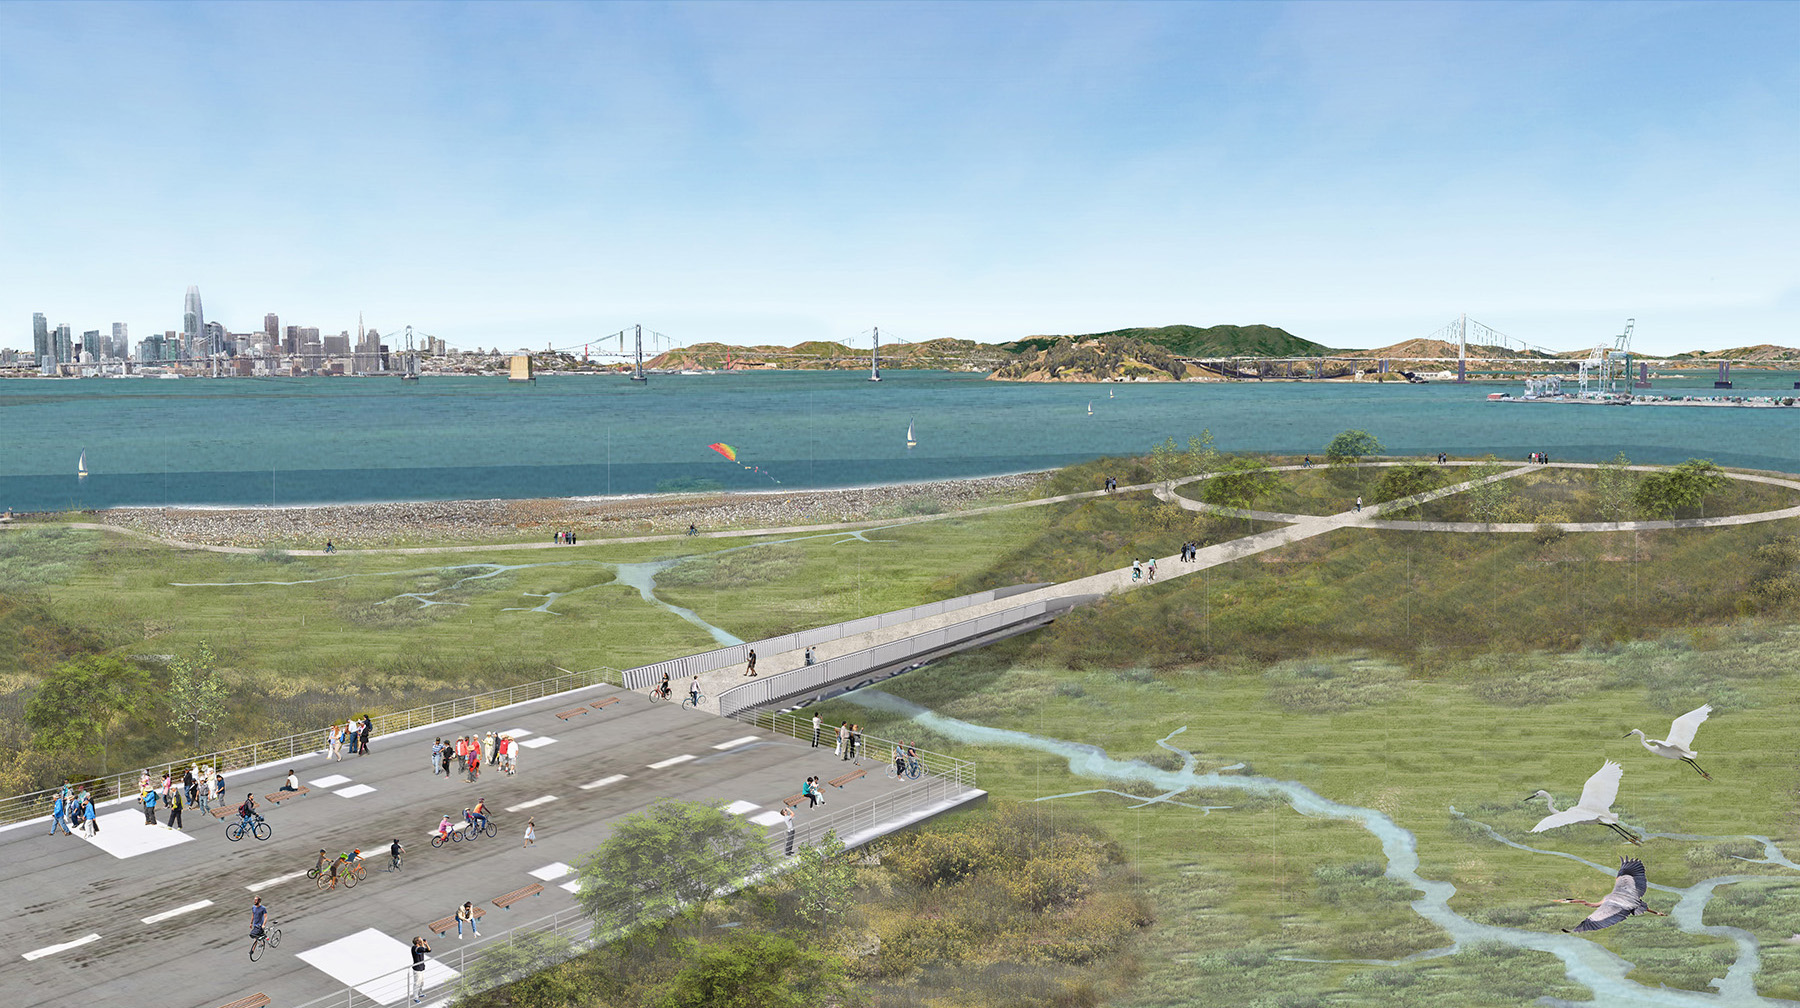
With the RAAPP, East Bay Parks sought to develop “implementable projects” that could begin to make a difference on the ground, Holt says. In this manner, the plan offers a “road map” for the district, working with neighboring cities and other partner agencies, to pursue projects addressing sea level rise, he says. The RAAPP includes eight priority sites for adaptation. Of these, three are developed in more detail to serve as prototypes.
As for potential adaptation measures to be implemented, the RAAPP emphasizes nature-based solutions to the extent possible in order to contribute to ongoing regional efforts to restore wetland and intertidal habitats lost to development around the Bay. “That’s a big focus of our work,” Holt says.
“We see an opportunity in these adaptation responses to provide for that habitat restoration.” At the same time, such approaches provide various “co-benefits,” Holt says, including increased shoreline resiliency and protection of nearby infrastructure and other assets.
At the moment, the projects detailed in the RAAPP remain largely conceptual, as East Bay Parks seeks funding to support its efforts and engages with potential partners. “These are big interjurisdictional projects,” Holt says.
Coastal concerns
Efforts to protect coastal communities from sea level rise and storm surge by means of traditional engineered solutions must address a host of physical and logistical challenges, says Jonathan Goldstick, P.E., the senior director, waterfront and marine, for the engineering and environmental consulting firm Langan.
When protecting structures, “your first strategy is to elevate,” Goldstick says. “But the question is, ‘What (height) do you elevate to?’ You have to go with predictions of what future sea level rise will be and what future storm surge could be.”
The next strategy, constructing perimeter walls around the location to be protected, raises even more questions, particularly when conducted at the scale of a neighborhood or town. Such approaches essentially amount to building a “bathtub” around the protected area, Goldstick says.
“But when the storm isn’t coming, life has to go on,” Goldstick notes. “Now you need to put openings in that bathtub” to accommodate vehicle and pedestrian traffic and other routine daily activities, he says.
“When the storm comes, you have to close all those openings,” Goldstick says. “Then you have to figure out who’s responsible for closing them. How do they decide when they’re closing them? How can you make sure the people who are supposed to close them will be there to close them because maybe they’re running home to make sure their house hasn’t flooded?”
Complicating matters further, underground sanitary sewers and storm sewers must be designed to prevent floodwaters from entering the area by those means. Meanwhile, cutoff walls must be constructed below ground to prevent groundwater from rising to the surface, but their construction must account for the presence of existing utilities. “These are very, very intrusive measures,” Goldstick says.
Ultimately, leaving individual communities to address sea level rise on their own is a flawed strategy, Goldstick says. “Because sea level rise is happening across large regions, this isn’t a local question,” he says. “It probably needs to be addressed in a national way that decides what the national priorities are and where money should be directed.” However, “we’re trying to solve a huge regional or national problem one town and one city at a time,” he says. “It’s a very inefficient way of doing it. And we probably can’t make everything as resilient as it needs to be.”
Along the waterfront
Fortunately, fortifying individual infrastructure installations on a coastline tends to be much easier than protecting an entire community. In such cases, coastal utility owners should conduct vulnerability assessments to ascertain the climate risk of a given facility and then determine the various resilience options available, says Craig Wells, P.E., ENV SP, the Florida client services manager for the engineering, planning, and consulting firm Freese and Nichols Inc.
In analyzing these options, utilities must consider the cost to design, construct, and maintain the resilience options as well as the potential social and economic costs that could result from a long-term interruption of operations at the facility in question, Wells says. “You need to take all those costs into account,” he says. “The whole vulnerability analysis will boil down to a benefit-cost analysis. That will usually dictate what resilience measures” should be implemented.
As for alternatives for protecting infrastructure against storm surge, a wide variety of deployable barriers are available for use when needed, Wells says. A more substantial, permanent approach could entail constructing a berm made of sheet piles. Also possible is a hybrid approach in which deployable barriers are situated on top of a berm. “I’ve seen that done at a number of places,” Wells says.
Although elevating or relocating entire existing facilities typically is not cost-effective, the same often is not true for equipment that is vulnerable to damage from water. “You can certainly elevate those,” Wells says. Along these same lines, another option is to “live with the water” instead of fighting it. “You have areas within a facility that are designed to operate in a flooded state.”
Generally speaking, practically any action taken to improve resilience is better than doing nothing, Wells says. “I’ve never seen a situation, in doing this for close to a decade now, that the do-nothing approach is a good approach.”
Wells goes further, offering advice that applies not only to protecting coastal infrastructure, but that can also be applied to other efforts to prepare for the effects of climate change, be it in the form of drought, floods, or sea level rise: “Don’t stick your head in the sand,” he says. “Understand what’s going on. Understand what’s likely to happen to you, and then you can act. If you wait until it does happen, it’s way too late.”
Jay Landers is a contributing editor to Civil Engineering magazine and editor of onewaternews.com.
This article first appeared in the November/December 2022 issue of Civil Engineering as “Water in a Warming World.”