
By Kevin A. Moluf, P.E., M.ASCE, Dale Abbott, GISP, Richard P. Mathews Jr., P.E., M.ASCE, and Craig A. Schneider
When the University of North Carolina at Charlotte needed to explain unexpected behavior in the water distribution system, creating a digital twin was a critical part of the solution.
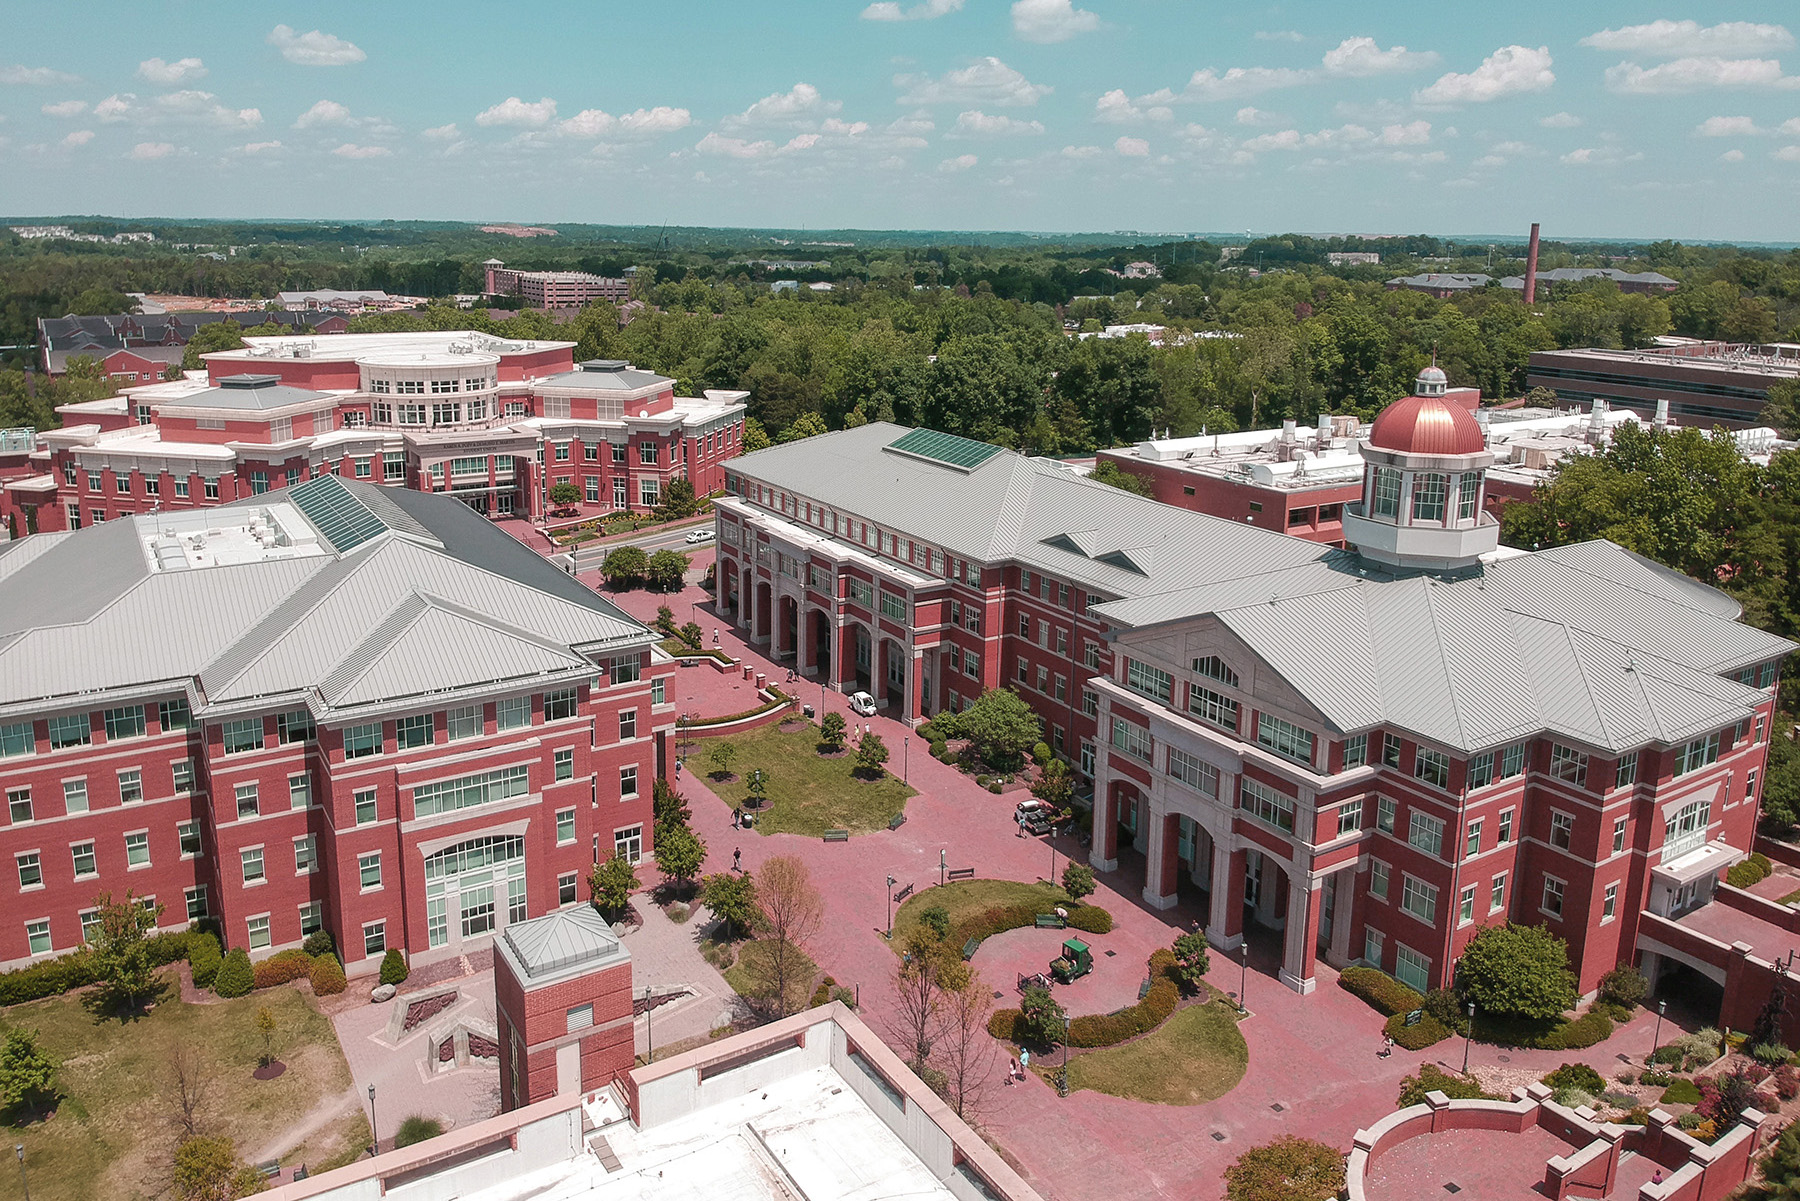
Rapid growth brings opportunity, but it also puts pressure on infrastructure. That is the reality at the University of North Carolina at Charlotte, where enrollment has grown by 14% over the past decade, surpassing 32,000 students and driving steady campus expansion. Today, the university spans more than 7.2 million sq ft across 130 buildings, with nearly half that space added in the last 12 years.
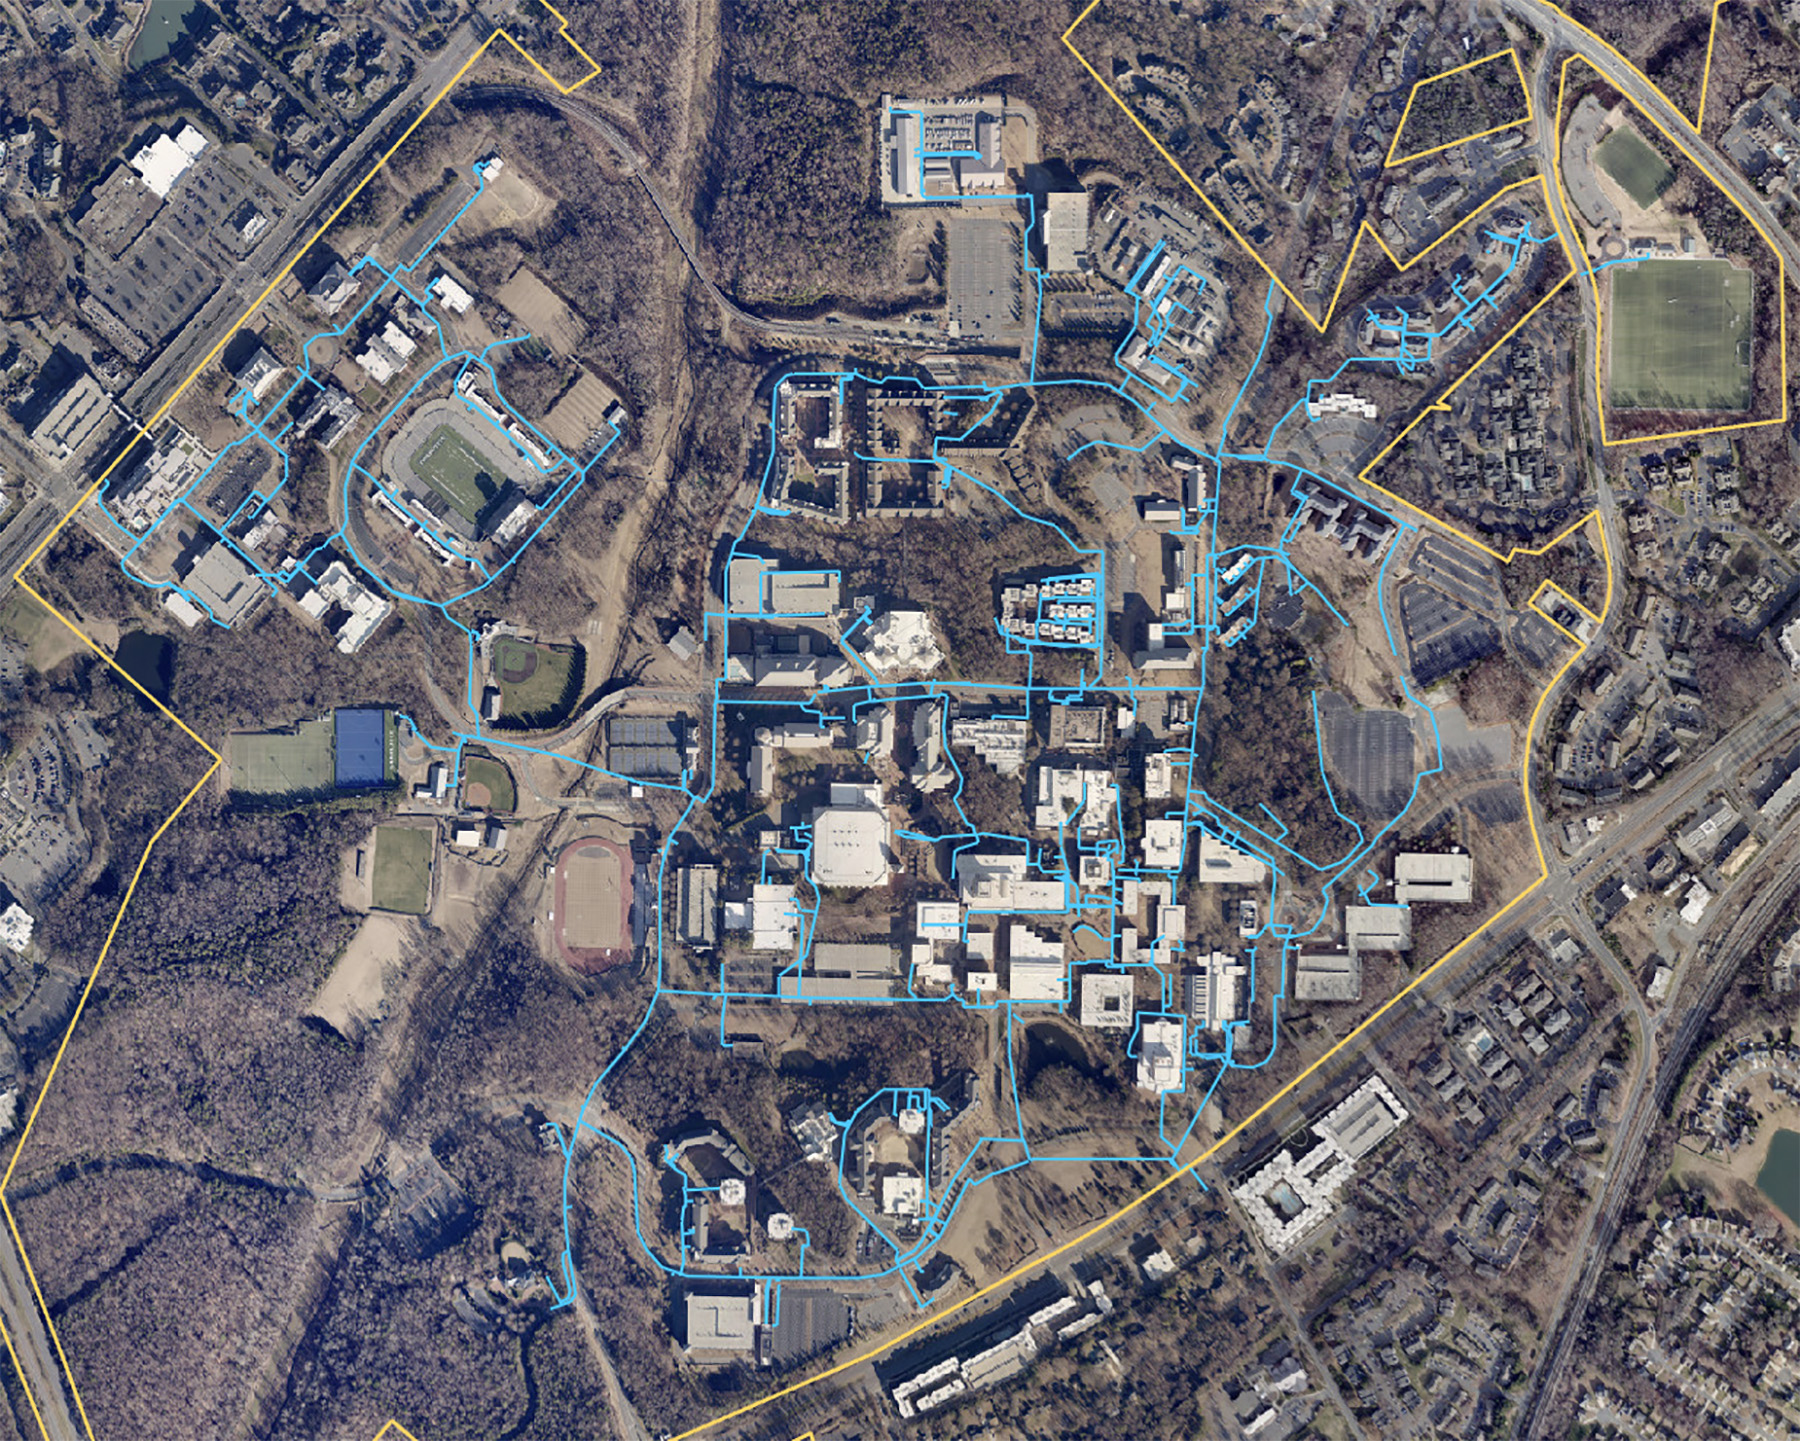
In addition to its buildings, UNC Charlotte owns and maintains many of the underground utilities on campus, including the domestic water distribution network. The campus water utility is comparable to that of a small town, with about 7 mi total of underground piping and three master connections supplying water from the surrounding city.
Starting in 2022, the university’s water distribution system came under scrutiny when three consecutive building projects, delivered by different contractors in disparate parts of campus, all flagged low fire flows during closeout. While site-specific remediation successfully brought each building adequate water volume and pressure for firefighting, the repeated issue of low fire flow raised a critical question: Did these local fixes solve the problem or mask the symptoms of a broader hydraulic challenge?
To answer that question, the university’s engineers needed to understand how the water system was performing as a connected whole. The best tool for that purpose was a digital twin, a virtual model that mirrors the dynamic behavior of its real-world counterpart through the passage of time. This tool would allow a project team to examine the entire system’s response to local changes in operating conditions that would otherwise be difficult to test and observe on the real-world system.
Surveying the data landscape
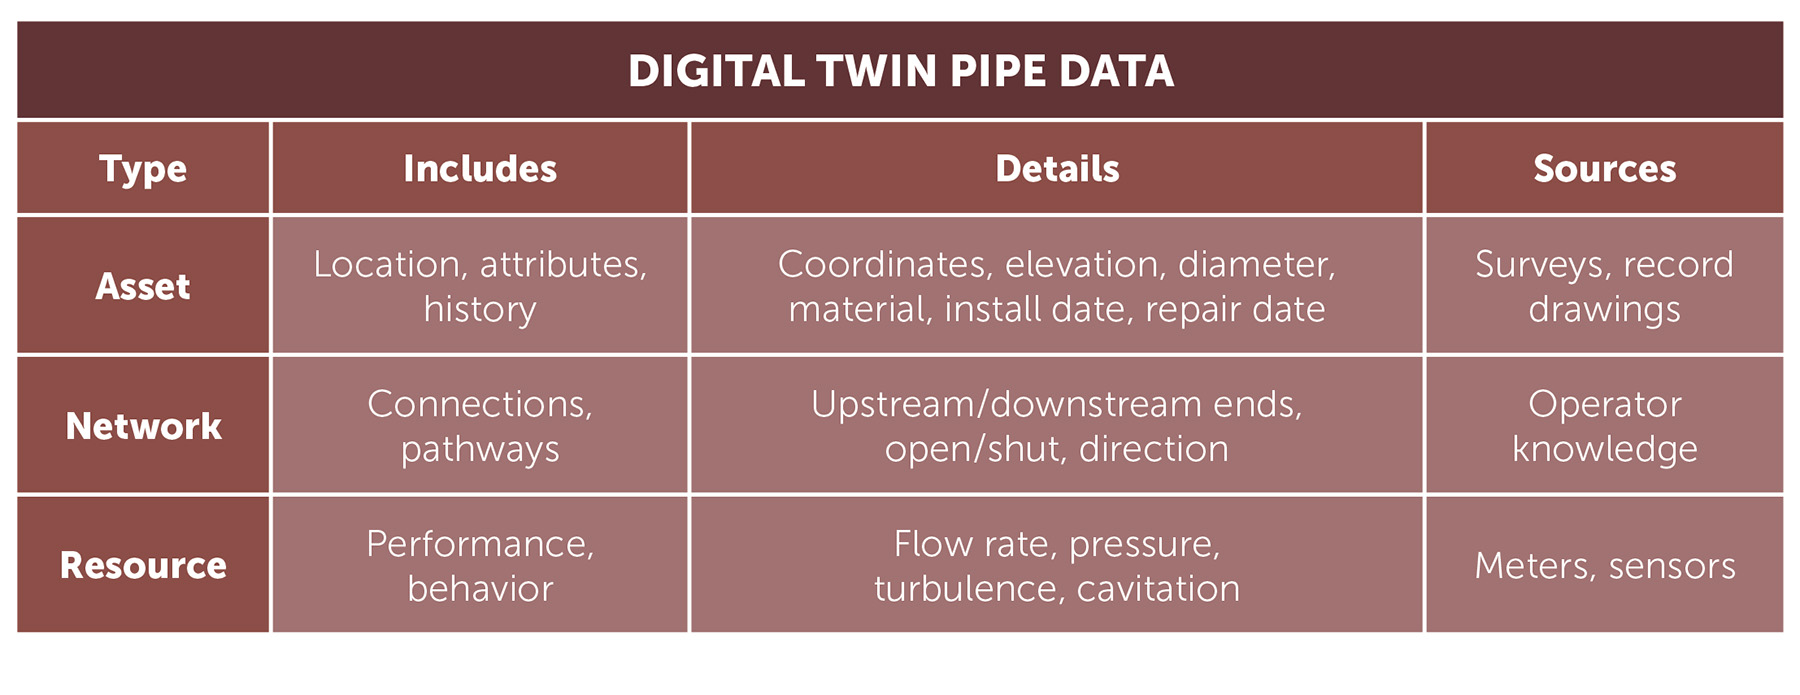
A digital twin for a utility needs data about three things: the assets, the network, and the resources. Asset data describes an infrastructure unit in terms of location, history, and physical characteristics, also called attributes. Network data describes how the assets are connected to each other and the resource pathways through them. Resource data captures system performance and behavior.
In the case of a single pipe, the asset data includes its coordinates and elevation, diameter and material, and dates of installation or repairs. The network data specifies what pressure zone the pipe is in, what is connected at either end, and which direction, if any, water can flow through it. Finally, the resource data for a pipe includes flow rate and pressure as well as turbulence and cavitation (reduction of a liquid’s static pressure below its vapor pressure).
A digital twin uses these data sources in the application of a mathematical framework to model real-world physics. For water distribution, this is commonly known as a hydraulic model. The underlying math uses standard engineering principles (Bernoulli’s equation, mass balance, head loss) to calculate the flow rates and pressures throughout the network from the inputs of just a few known conditions.
At UNC Charlotte, the necessary data and hydraulic model already existed. University staff had cataloged the water utility in a centralized geographic information system, but it maintained the catalog primarily for mapping rather than for operational analysis. Pipes in the GIS were often imported directly from construction drawings, and attributes such as elevation and material were inconsistently labeled or frequently omitted. Furthermore, the pipe connections in those drawings often appeared intact at the site scale but were not connected when examined at the asset scale, which led to maps in the GIS that were not accurate enough for the needs of a digital twin.
Another issue was that the university’s existing hydraulic model was limited in its ability to evaluate the whole system. Instead, the model was only used sporadically and for a single building at a time to confirm information about the handful of pipes that provide firefighting in the immediate area. This local context was practical for being able to ignore the systematic effects of fluctuating conditions at the interconnections with the city’s distribution system, but it was at the cost of also ignoring the operation of other buildings on campus.
The irony of this limited-use case was that the high-fidelity data was already available. For a decade or more, the campus water meters have been reporting data to the centralized building automation system, with many buildings reporting readings every 15 minutes. Despite this wealth of information, these readings were seldom reviewed for any purpose beyond monthly utility billing.
Building a digital twin from these siloed tools would require data improvements, integration, and a maintenance plan that would keep the virtual model in sync with the real-world system.
Redeveloping the data foundation
The effort to synthesize the data began in earnest at the end of summer 2023 with the decision to reinstate the university’s hydraulic modeling license, which had lapsed because of disuse. This decision resulted in the first hurdle: a nine-month procurement delay for legal negotiations regarding the fact that the university, a state entity, could not agree to software terms requiring arbitration in another state. While frustrating, the administrative deadlock provided an opportunity to assess the other available data and keep the vision of developing a digital twin moving forward.
The poor state of the existing GIS presented a strategic opportunity: Rather than trying to patch the existing maps to support functions they were never designed for, the university could simply rebuild. Starting with a new data foundation would create the necessary structural integrity for the GIS to fulfill its role in the future digital twin. With that mindset, the university’s engineers sought out and reviewed relevant international, federal, and state standards on the topic, such as ASCE 38-22 (Standard Guideline for Investigating and Documenting Existing Utilities) and ASCE 75-22 (Standard Guideline for Recording and Exchanging Utility Infrastructure Data).
To determine the best path forward, the engineers compared the requirements of the standards they had reviewed against the data models used by the university and the broader utility industry. Through this analysis, the engineers identified a suitable replacement for the existing data model that had been developed by Esri for its ArcGIS platform, the same one the university already used.
The utility network data model uses a standardized list of assets and attributes and comes with prebuilt topology rules to enforce digital logic. These rules ensure that the virtual maps mirror real-world physical networks, even when the lines imported from construction drawings might not. This off-the-shelf functionality addressed many of the observed issues present in the legacy GIS.
Crucially, migrating to the utility network model did not trigger the same procurement hurdle that stalled the existing hydraulic modeling software. An existing procurement agreement covered the necessary licensing, and the expanded capabilities of the utility network were activated within the same week that the university signed an amended user agreement for the hydraulic model.
Mobilizing the data project
With the internal data audit complete and software licenses in hand at the start of summer 2024, it was time to shift from planning to action. While university staff had the expertise to build the digital twin in-house, the demands of daily campus operations meant an internal build could stretch out five years or more. Soliciting an external consultant could jump-start the process, but that meant securing funds for a formal project.
If the university operated like a municipal utility, both capital projects and operational projects would be funded by the ratepayers. Instead, the state appropriations process means that while the university can typically request dedicated funds for a capital project, an operational project must be funded from the allotted budget. In practice, this means that many operational projects, such as building a digital twin, are “one-time funded” with surplus budget, such as from lapsed salaries. The method is convenient for hiring outside help but also constrains the project to a strict end-of-fiscal-year timetable.
The tight, 12-month funding window led to an abbreviated internal scoping process that attempted to cover all the known deficiencies. The requested project scope grew ambitiously to include the GIS data migration; data improvements; the existing fire flow modeling; an extended period simulation that would allow for a 24-hour operating look at the whole campus; meter evaluations; field investigations, including hydrant-flow testing and subsurface exploration; and future technology planning. These needs were all related to the process of building a digital twin, but their combined complexity demanded expertise capable of mitigating the aggressive project schedule.
To that end, the university selected VHB, a multidisciplinary engineering, planning, and environmental consulting firm, as the prime consultant for the hydraulic water system analysis, GIS and data-gap analysis, and digital twin development. VHB distilled this sprawling scope into a logical roadmap that emphasized the goal of building a more complex model from high-quality data.
The work was sequenced to prioritize system understanding and needs identification first; then simultaneously address GIS data migration, meter data analysis, and field testing; and finish up by feeding the improved data into the hydraulic model. This structured approach transformed an overwhelming scope into a series of impactful milestones that would ensure steady progress within the expedited timeframe and provide a blueprint for future refinements to the digital twin after the initial project window.
Laying the data pipeline
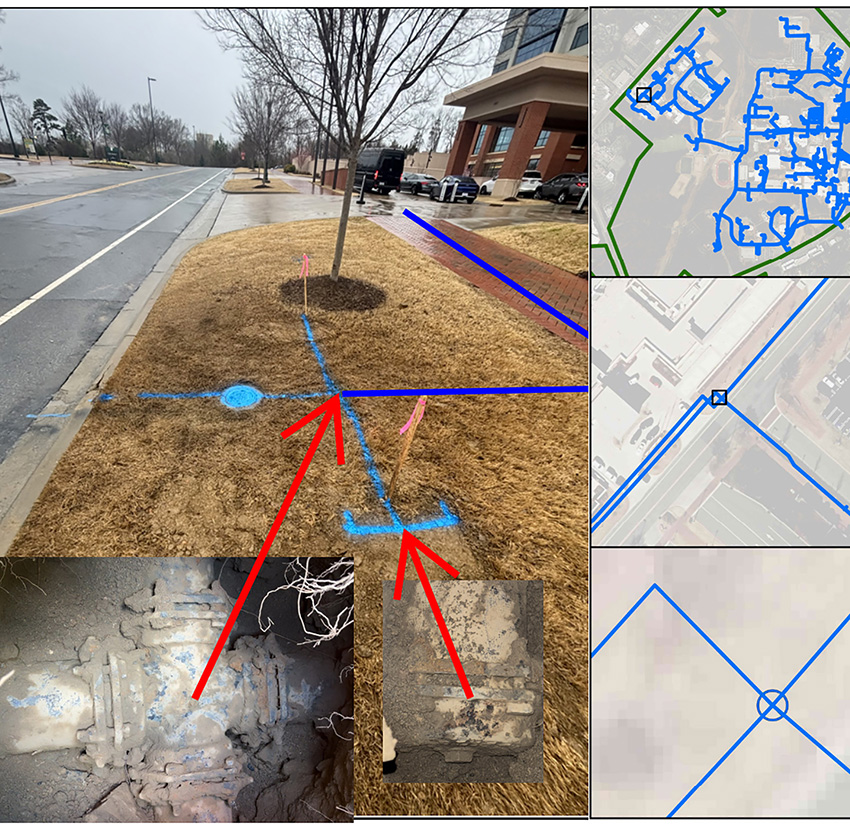
VHB recognized early that the success of the digital twin depended on the quality of the underlying data. It identified that many of the missing attributes in the GIS — such as pipe size, material, and elevation — had been assigned in the hydraulic model. Additionally, VHB found that the model had also been built with key connection points, like pipe tees, that were also missing in the GIS. This was due to limitations in legacy CAD imports and historically limited tracking of buried features such as fittings. By combining information from multiple sources and updating the digital maps, the team created a more accurate representation of how the system was built underground.
 Edit photo credit]
 Rather than treating all data equally, the team adopted a subsurface utility engineering approach that distinguished historical records from field observations as described in ASCE 38-22.
Subsurface utility engineering as a practice applies the accuracy targets of traditional surveying to the typical construction task of locating utilities by using additional subsurface exploration technologies such as ground-penetrating radar.
When conducted in accordance with ASCE 38-22, subsurface utility engineering can provide greater levels of certainty about the location and position of underground utilities, especially those constructed in the previous millennium, when construction records alone may be incomplete or misleading.
Each utility feature was tagged with a confidence level reflecting how the data was collected (whether by construction record, ground survey, subsurface survey, or soft dig).
Migration to the utility network revealed more than 1,500 topology errors during the initial validation, highlighting broken connections in the virtual system. Adding the previously identified fittings back in from the legacy hydraulic model and correcting drafting inconsistencies, such as small gaps or overlaps between pipes, resolved approximately 95% of those errors. The remaining issues, however, were more subtle.
 dit photo credit]
 Some features had been misclassified during conversion from CAD to GIS, such as the outline of a backflow preventor being interpreted as pipes instead of a covered concrete pad. In other instances, the pipes needed to be redrawn in the opposite direction to align the modeled flow with the real world — for instance, distinguishing between the incoming and outbound pipes at a meter.
VHB recommended a simple approach to improving those details. The GIS would serve as the single source for all utility information. All authoritative updates would be made there first and then shared with the hydraulic model that was used to simulate system performance.
This one-way workflow reduces the risk of conflicting edits or accidental overwrites that can occur when multiple systems are updated simultaneously. Having a single source of utility information strengthened organizational confidence in the data and resolved many inconsistencies that had limited earlier modeling efforts.
With the missing asset data filled in and the network data free of topology errors, the digital twin was successfully framed with data the university could trust.
But just as pressure testing will prove whether a pipe holds water, the updated network needed the resource data to truly become a digital twin, and the meter records presented their own challenges.
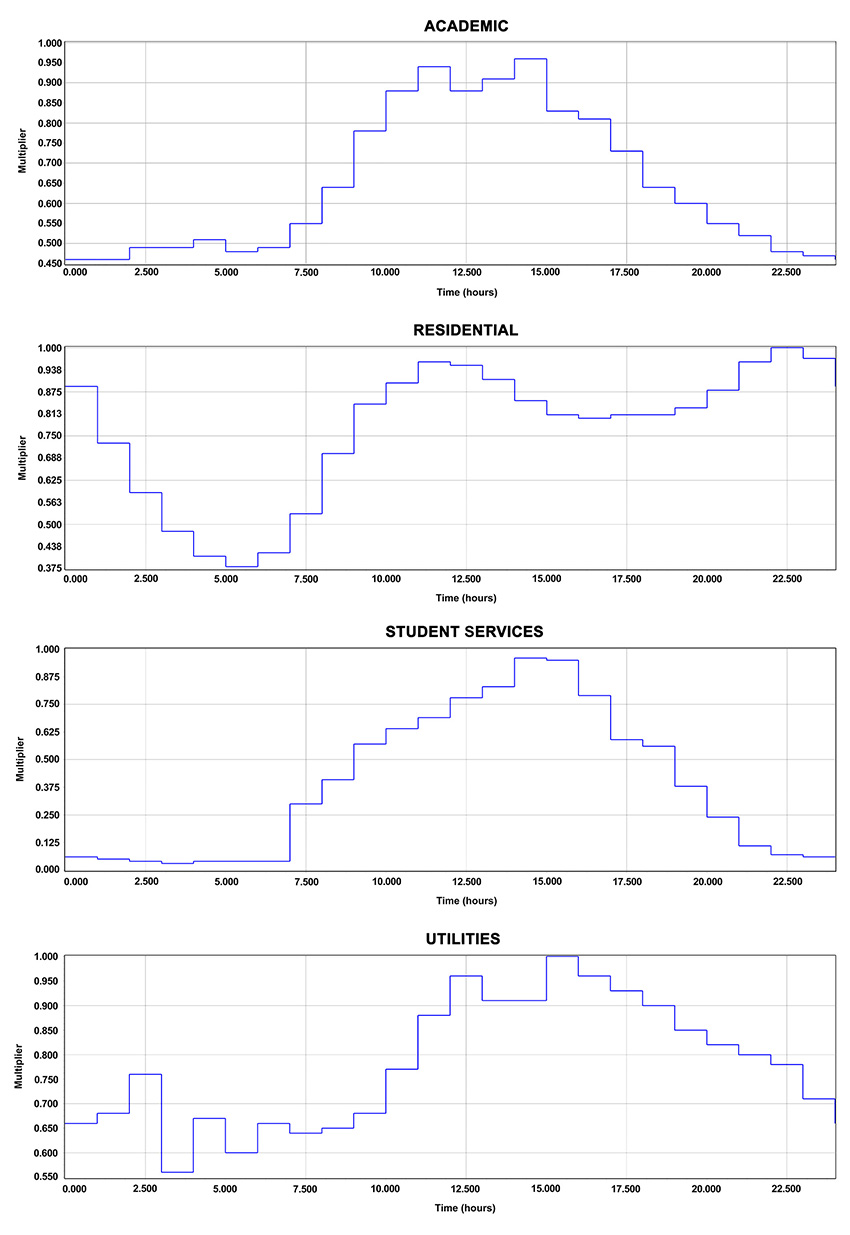
While detailed digital water-use records were available, some files were too large to process, and others contained gaps tied to older collection practices. Rather than forcing imperfect data into the model, the team selected representative buildings with consistent records to establish demand patterns.
These patterns grouped the campus uses into four categories: academic, residential, student services, and utilities.
This approach allowed the digital twin to reflect typical daily demand without relying on incomplete data, balancing accuracy and usability with the opportunity for future refinements. With all three data components loaded, it was time to run the model (left).
Operating the data cycle
A significant insight from the model should have been obvious when looking at the university from a bird’s-eye view. The campus is in Charlotte’s lowest water-pressure zone, with only about 100 ft of hydraulic head between the highest point on campus and the low operating point of the water tower. For example, at the top of the hill sits a building with pressures so anecdotally low that flushing second-floor restrooms is a challenge, while a building with chronic high-pressure maintenance issues is at the lowest point next to the floodway.
But although elevation change is a critical aspect of the UNC Charlotte topography, its impact was overlooked in hydraulic designs. As a result, new campus guidelines have been added to head off specific pressure challenges resulting from a building’s ground elevation.
While the static data highlighted a powerful but overlooked principle, the 24-hour dynamic model answered a part of the original fire flow question. As the campus ramps up to midday peak water usage, the model suggested pressure drops at all three master connections, which was characteristic of undersized pipes. Upsizing those pipes is now an area of further study because the immediate cause was identified as the master meters themselves.
The repeat low fire flows were all taken during high water usage times on campus when flows through the older turbine meters at the master connections exceeded their rated capacities. Ironically, the university realized this about two weeks after the city did, and the master meters were replaced with high-capacity ultrasonic meters free of charge because the higher flows were also under-registering, leading to lost revenue for the city.
VHB wrapped up its portion of the project on schedule in July 2025. The data management approach it applied has reinforced a central takeaway: A digital twin is not a one-time deliverable. It is a living tool that improves through use, with each resolved issue often revealing the next opportunity for refinement. By anchoring a hydraulic model in accurate, well-managed data, UNC Charlotte now has a digital twin capable of generating systemwide insights.
The university is better equipped to diagnose issues, test solutions, and make informed decisions with confidence. More importantly, it has established a repeatable approach that can evolve, supporting safer operations and smarter infrastructure planning as the campus continues to grow.
Kevin A. Moluf, P.E., M.ASCE, is a water and sewer engineer at the University of North Carolina at Charlotte. Dale Abbott, GISP, is the corporate GISP lead for VHB. Richard P. Mathews Jr., P.E., M.ASCE, is an assistant chief engineer for VHB. Craig A. Schneider is the Mid-Atlantic regional technology leader for VHB.
This article first appeared in the July/August 2026 issue of Civil Engineering as “A Water System’s Digital Twin.”


